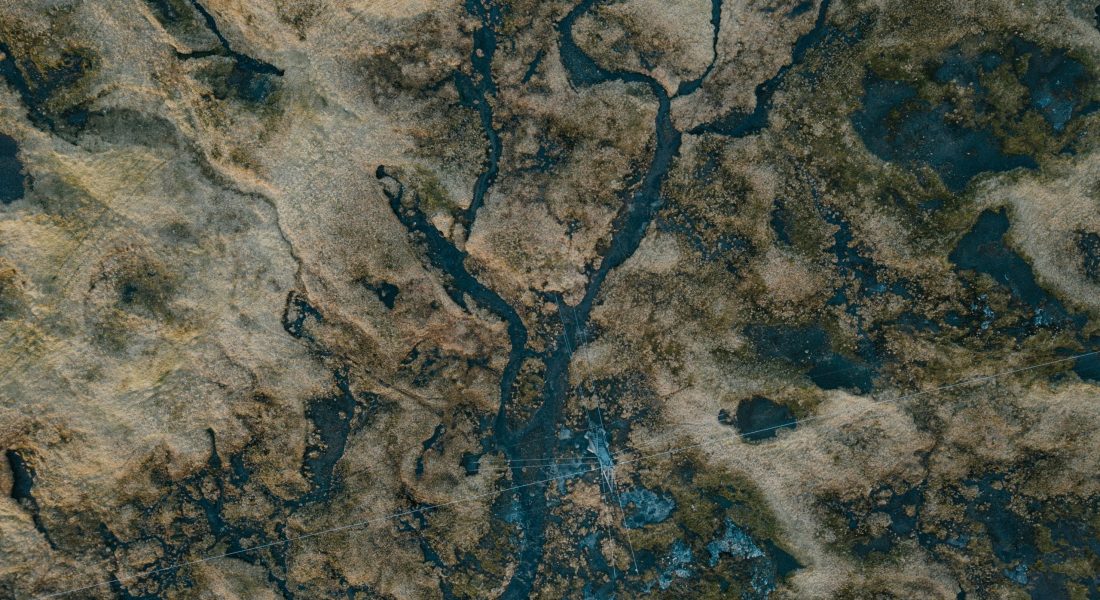
Surface water changes fast, especially when you’re dealing with floods, seasonal shifts, or long-term drought patterns. Whether you’re in environmental research, infrastructure planning, or climate monitoring, having the right tools to map and track water bodies isn’t just helpful, it’s essential. In this guide, we’re walking through a mix of platforms that make surface water mapping more precise and less time-consuming. Some lean into satellite imagery, others plug in AI, and a few stand out for their open-source flexibility. This isn’t a fluff list, we’re focusing on tools that actually get used in the field, by people who need real answers, not just pretty maps. Let’s dig in.

1. FlyPix AI
At FlyPix AI, we’ve built our platform to make surface water mapping faster, more precise, and easier to scale. Our GeoAI platform gives users the ability to detect, segment, and track water bodies across satellite and drone imagery without writing a single line of code. Whether you’re looking to monitor changes after a flood or analyze seasonal surface water trends across large areas, our tool helps automate that work in just a few clicks.
We support fully custom geospatial workflows, so you’re not limited to out-of-the-box models. You can train your own AI to pick out specific features that matter in your environment, whether that’s tracking standing water, tracing shoreline changes, or combining surface water with other landscape data. From public sector teams to environmental consultants, we work with people who need flexible tools that fit into existing systems and actually help solve field problems, not just visualize them.
Key Highlights:
- No-code platform for fast object detection in imagery
- Custom model training for surface water detection
- Works with satellite, drone, and multi-source data
- Interactive sandbox for testing and validating workflows
- Scales from small project sites to regional mapping
Services:
- AI-based surface water mapping and detection
- Custom pipeline setup for hydrological analysis
- Data sourcing and preprocessing from satellites or UAVs
- Object segmentation and change monitoring
- White-label and enterprise deployment options
Contact Information:
- Website: flypix.ai
- Phone: +49 6151 3943470
- Email: info@flypix.ai
- Address: Robert-Bosch-Str. 7, 64293 Darmstadt, Germany
- LinkedIn: www.linkedin.com/company/flypix-ai

2. Wisconsin Department of Natural Resources (Surface Water Data Viewer)
The Surface Water Data Viewer (SWDV) from Wisconsin’s Department of Natural Resources is a browser-based tool designed to make a wide range of environmental data accessible and usable. It lets users view surface water datasets such as water chemistry, sediment sampling, fish populations, and physical characteristics through a flexible map interface. The tool is structured with tabs for different themes, allowing users to explore targeted layers without having to manually toggle between datasets. Themes cover wetlands, dams, floodplains, designated waters, and more.
The SWDV recently transitioned to a new web platform to improve performance and support. While much of the original functionality was retained, updates have made it easier to work with shapefiles, adjust coordinate systems, and load custom geospatial data. For anyone working with surface water data in Wisconsin or using similar regional tools elsewhere, this viewer offers a practical example of how to integrate public datasets into mapping workflows without relying on commercial platforms.
Key Highlights:
- Thematic tabs for water chemistry, biology, and physical features
- Shapefile and lat/long upload support
- Switchable coordinate systems
- Predefined views for wetlands, dams, and more
- PDF user guide and release notes available
Services:
- Interactive web-based water data visualization
- Surface water quality layers
- Access to sediment, fish, and macroinvertebrate data
- Watershed and monitoring layer integration
- Export and reporting features
Contact Information:
- Website: dnr.wisconsin.gov
- Phone: 1-888-936-7463
- Address: Wisconsin Department of Natural Resources, 101 S. Webster Street PO Box 7921 Madison, WI 53707-7921
- LinkedIn: www.linkedin.com/company/wisconsin-department-of-natural-resources
- Facebook: www.facebook.com/WIDNR
- Instagram:www.instagram.com/wi_dnr

3. Stantec (Surface Water Assessor)
Stantec’s Surface Water Assessor is a GIS-based tool built to evaluate where sustainable drainage systems (SuDS) can be implemented, particularly in urban or developed areas. The tool blends digital terrain data, sewer networks, and mapping layers to trace surface water flow paths and visualize impermeable surfaces. Users can assess individual locations or larger catchment areas and get quantitative breakdowns of potential drainage opportunities and estimated installation costs.
The platform stands out for how customizable it is. Users can modify algorithms, set flow path tolerances, and explore different rainfall scenarios to refine the outputs for specific projects. Visual outputs help in identifying road and roof areas where water could be intercepted, along with the infrastructure needed to connect these points to storage or discharge systems. It’s a technical, but user-directed tool for infrastructure planning and runoff management.
Key Highlights:
- Combines LiDAR, sewer, and land-use data
- Visual outputs for impermeable surfaces
- Calculates runoff interception potential
- Customizable for different rainfall return periods
- Supports both individual sites and large-scale regions
Services:
- GIS-based SuDS planning and opportunity assessment
- Flow path and elevation tracing
- Estimation of required infrastructure
- Road and roof surface analysis
- Algorithm tuning for project-specific scenarios
Contact Information:
- Website: www.stantec.com
- Phone: +44 1454 619533
- Email: askstantec@stantec.com
- Address: Over Court Barns, Over Lane, Almondsbury, Bristol, United Kingdom BS32 4DF
- LinkedIn: www.linkedin.com/company/stantec
- Facebook: www.facebook.com/StantecInc
- Instagram: www.instagram.com/stantec
- X (Twitter): x.com/Stantec

4. New Hampshire Department of Environmental Services (NHDES)
The New Hampshire Department of Environmental Services provides a set of interactive web-based viewers designed to support surface water quality assessments. These tools give users access to spatial information on water assessment units across the state. By using the maps, individuals can see where sampling data has been collected, which areas have documented impairments, and how surface water quality has changed across different assessment years. The viewers are organized by reporting cycle, with separate portals for each biennial dataset going back to 2012.
Each map viewer allows users to explore both historical and recent water quality data in a simple, geographic format. The interface includes filtering options and clickable layers that reveal summary statistics and status indicators for specific water bodies. While the platform doesn’t include advanced modeling or AI features, it’s a reliable source for basic visual assessment and review of regulatory datasets. It serves agencies, consultants, and the public who need to track surface water conditions or review compliance reports.
Key Highlights:
- Interactive maps by reporting year
- Visual representation of assessment units and impaired waters
- Clickable spatial layers with summary info
- Straightforward map-based interface
- Public access to regulatory datasets
Services:
- Surface water quality data viewing
- Spatial exploration of waterbody assessments
- Historical water quality tracking
- Status classification of impaired waters
- Downloadable datasets and documentation
Contact Information:
- Website: nhdes-surface-water-quality-assessment-site-nhdes.hub.arcgis.com

5. Washington State Department of Health (Source Water Assessment Program)
The Source Water Assessment Program (SWAP) from the Washington State Department of Health provides a GIS-based mapping tool that focuses on drinking water source protection. It helps water utilities and the public visualize protection zones and evaluate the proximity of potential contaminants to those sources. Users can search for a specific area using a system name, ID, or address, then overlay different data layers to understand watershed boundaries and contamination risks.
The tool is designed to support prevention efforts by helping stakeholders understand the spatial relationship between drinking water sources and human activities. It’s mostly aimed at source water planning, but the GIS layout also makes it usable for surface water reviews where drinking water is sourced from lakes, rivers, or reservoirs. Updates or corrections to the maps can be submitted through official channels, making it a collaborative platform tied to current data governance standards.
Key Highlights:
- GIS-based tool for source protection area mapping
- Search by system ID, name, or address
- Layered view of protection zones and contaminants
- Interactive navigation with zoom and click options
- Built-in correction and feedback mechanism
Services:
- Mapping of source water protection areas
- Access to contamination-related spatial data
- Visual tools for public water supply planning
- Layer toggling and system-level detail
- Documentation and submission channels for updates
Contact Information:
- Website: doh.wa.gov
- Phone: 360-236-4700
- Email: HSQA.CSC@doh.wa.gov
- Address: Town Center 2 111 Israel Rd. S.E. Tumwater, WA 98501
- LinkedIn: www.linkedin.com/company/wadepthealth
- Facebook: www.facebook.com/WADeptHealth
- Instagram: www.instagram.com/wadepthealth
- X (Twitter): x.com/WADeptHealth

6. U.S. Environmental Protection Agency (WATERS GeoViewer)
The EPA’s WATERS GeoViewer is a web-based mapping tool that provides access to a wide range of spatial datasets related to the United States’ surface waters. Built on the EPA GeoPlatform, it connects users with core data like NHDPlus, StreamCat, and linked watershed data. The tool allows for both upstream and downstream exploration, which can be especially useful for tracking pollutant pathways or understanding watershed dynamics in real-time scenarios.
WATERS GeoViewer supports interactive watershed delineation and links users directly to detailed attribute reports from both EPA and non-EPA sources. Users can explore data at the watershed level and drill down into specific layers for more focused insights. While the interface leans toward experienced users, the inclusion of linked data reports and the ability to build custom maps makes it valuable for both researchers and practitioners working in water resource management.
Key Highlights:
- Based on EPA’s GeoPlatform
- Access to datasets like NHDPlus and StreamCat
- Linked Data and watershed-level reporting
- Upstream and downstream tracing tools
- Supports creation of other mapping applications
Services:
- Surface water and watershed data visualization
- Watershed delineation and tracing tools
- Integration with EPA-linked data reports
- Stream network and catchment analysis
- Mapping outputs usable in external apps
Contact Information:
- Website: www.epa.gov
- Phone: (202) 564-4700
- Address: Environmental Protection Agency, 1200 Pennsylvania Avenue, N.W. Washington, DC 20460
- Facebook: www.facebook.com/EPA
- Instagram: www.instagram.com/epagov
- X (Twitter): x.com/epa

7. Global Surface Water Explorer (European Commission, JRC)
The Global Surface Water Explorer (GSWE) is a satellite-data-driven platform that maps water surface changes across the globe over the past several decades. Developed by the European Commission’s Joint Research Centre in partnership with Google and UN Environment, the tool offers a time-series analysis of water bodies, using Landsat imagery to track both seasonal and permanent changes in surface water. This long historical range makes it especially useful for understanding trends in water availability, loss, or expansion.
The interface is simple to navigate and includes visual timelines, interactive maps, and downloadable datasets. Beyond visualization, GSWE supports applications in water management, climate modeling, biodiversity research, and environmental policy. It’s designed to be open and accessible, making it a practical tool for decision-makers, researchers, and NGOs who need reliable data on water extent without dealing with access restrictions or complex software setups.
Key Highlights:
- Covers global surface water from the past 3.8 decades
- Developed under the Copernicus Programme
- Uses consistent Landsat satellite imagery
- Offers downloadable data and interactive time-lapse maps
- Free and open to all users
Services:
- Global water extent visualization and statistics
- Historical trend analysis for lakes, rivers, and reservoirs
- Timelapse and change detection tools
- Data export for research or reporting
- Support for SDG 6.6.1 tracking and environmental planning
Contact Information:
- Website: global-surface-water.appspot.com
- Email: jrc-surfacewater@ec.europa.eu
Conclusion
Surface water isn’t static, and neither are the tools we use to monitor it. What used to take days with ground surveys and scattered spreadsheets can now happen in minutes using satellite data, AI models, and browser-based mapping tools. The platforms we’ve covered in this article reflect that shift: from highly local regulatory viewers to global-scale explorers and customizable AI pipelines. There’s no one-size-fits-all solution, and honestly, that’s a good thing. Different tools serve different needs, whether you’re working on regulatory compliance, research, disaster response, or just trying to make better decisions with cleaner data.
What matters most is picking a tool that fits your actual workflow, not just the flashiest features. Some folks need historical trends going back decades. Others need rapid detection of water bodies after a storm. A few might even want to train their own models on edge cases. The point is, we’ve reached a place where that level of flexibility exists, and that’s worth using.
