

Satellites see the world differently and RGB imaging is one of the simplest, yet most powerful tools they rely on. By capturing light in red, green, and blue wavelengths, Earth Observation systems can generate accurate, detailed views of the planet’s surface. But the real value comes when these images are combined with intelligent analysis. From tracking construction progress to spotting flood damage in near real-time, RGB-based Earth Observation is no longer just for scientists. It’s becoming an essential layer in how infrastructure is managed, monitored, and maintained across industries.
Earth Observation Infrastructure: How Space Systems See the Planet
Earth Observation starts with one simple goal: to see what’s happening on the ground – from space – in a way that’s structured, scalable, and useful. That means more than just putting satellites into orbit. It’s about building an entire pipeline. Imaging hardware (optical, radar, multispectral) feeds into downlink stations. From there, the data flows into cloud-based platforms that process, align, and analyze it – often in near real-time. The infrastructure is both physical and digital, and it’s what turns raw pixel streams into answers.
What’s changed in the last few years isn’t just the number of satellites – though that’s grown fast – it’s the way this infrastructure works together. Smaller sensors. Faster revisit times. Open standards. And most importantly, smart automation layered into the system from the start. Today, EO infrastructure isn’t a black box. It’s a modular, constantly improving ecosystem that helps governments, engineers, insurers, and logistics teams track what’s happening in the real world with actual visibility, not assumptions.
RGB Imaging in Earth Observation: Why It Still Matters
Despite all the attention on radar, hyperspectral, and thermal sensors, most satellite imagery that ends up driving decisions still comes from good old RGB. It’s fast, intuitive, and works out of the box for a huge number of real-world tasks. You don’t need a PhD to understand what you’re looking at. And when paired with automation, RGB can move from “just a photo” to a structured, machine-readable layer. Here’s why RGB still holds its ground in modern EO workflows:
- Familiarity at all levels: RGB images look like what people expect. Whether it’s a local official or a field engineer, there’s no learning curve.
- High-frequency coverage: Many commercial constellations prioritize RGB, so there’s simply more of it – and it’s refreshed often.
- Baseline for object detection: Most AI models start here. Whether you’re detecting rooftops, roads, or debris, RGB is often the first training set.
- Works across industries: Construction, insurance, logistics, agriculture – RGB provides enough detail to act without overcomplicating the pipeline.
- Low processing overhead: Compared to multispectral or SAR, RGB is lighter, faster to handle, and cheaper to store or stream.
- Great for visual verification: If something feels off in the data, teams still go back to the RGB image to sanity-check what happened.
It might not sound flashy, but RGB is the visual backbone of how we understand Earth from orbit. And when paired with the right tools, it still delivers exactly what’s needed – quickly, clearly, and at scale.
FlyPix AI: Turning RGB Satellite Images into Actionable Infrastructure Insights
At FlyPix AI, we work at the intersection of satellite imaging and automation. Our platform uses AI agents to process RGB data from satellites, drones, and aerial sources – automatically detecting objects, changes, and issues across dense and complex scenes. Whether it’s a construction site, energy grid, port, or road network, we help teams move from raw imagery to insights in seconds, not hours.
What makes our approach different is scale and speed. With our tools, users can train custom detection models without writing a single line of code. Just annotate, run, and apply – even across large territories or ongoing infrastructure projects. Our system handles everything in the background, from object recognition to time-based monitoring.
We’re already supporting users in infrastructure, agriculture, ports, forestry, and government. Our tech is trusted by thousands of professionals across the world – and we’re proud to be part of programs like ESA BIC Hessen, NVIDIA Inception, and Google for Startups. You can find us on LinkedIn to see how we’re helping teams automate what they see from the sky – one RGB image at a time.
Infrastructure Monitoring from Space: Core RGB Use Cases
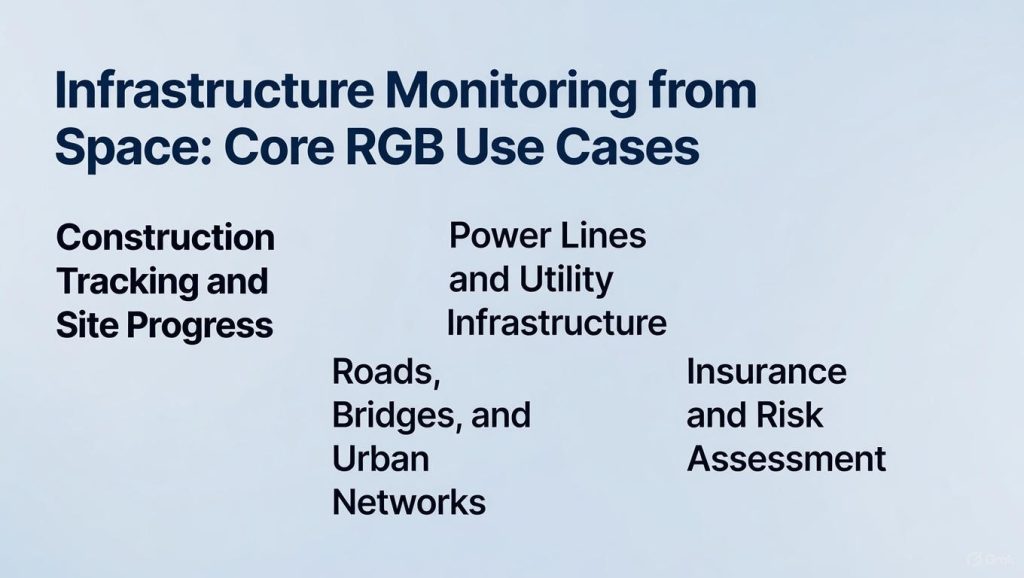
RGB satellite imagery continues to play a central role in infrastructure monitoring – especially when the goal is to get fast, visual, and actionable context without overloading the pipeline. Below are a few of the most common ways teams rely on RGB for real-world infrastructure work.
1. Construction Tracking and Site Progress
From initial site prep to ongoing build phases, RGB imagery helps visualize exactly what’s happening on the ground – without waiting for someone to send drone footage or schedule inspections. Teams use it to monitor changes over time, detect unplanned activity near the site (like trenching or new access paths), and flag anything that could slow down the timeline. When automated, this kind of tracking can scale across dozens or hundreds of locations.
2. Power Lines and Utility Infrastructure
Vegetation encroachment, equipment placement, terrain changes – these things are easy to spot with RGB once you know where to look. Power and utility operators use RGB imaging to monitor long corridors without field visits, verify clearances, and track changes seasonally or after major weather events. With AI in the loop, detection of at-risk segments becomes a routine, automated process.
3. Roads, Bridges, and Urban Networks
RGB imagery is a go-to layer for observing transport infrastructure in high-resolution and in context. It helps teams assess road condition, track new development, monitor traffic patterns, and document the state of assets like bridges and overpasses. Combined with timestamped archives, RGB lets engineers look back and understand when and where a shift or issue began – even before it was formally reported.
4. Insurance and Risk Assessment
For insurers and risk managers, RGB offers a practical way to see before-and-after conditions following natural or human-made events. Whether it’s a flood zone, a collapsed structure, or fire damage, high-frequency RGB coverage allows for quick verification and faster response. It’s also useful for building baseline imagery portfolios, making claim validation and planning less dependent on on-site reports.
RGB vs Other EO Sensors: Where It Fits Best
Not every monitoring task needs hyperspectral or radar data. RGB imaging remains one of the most practical tools in Earth Observation – fast to process, easy to interpret, and widely available. The key is understanding where it fits best and where it starts to fall short.
When RGB Is the Right Tool
For many use cases, especially in infrastructure and land monitoring, RGB gets the job done without extra complexity. It provides sharp, clear visual context, and works well with automated detection systems. Most commercial EO workflows still start here – and for good reason.
RGB works best for:
- Monitoring visible changes over time: Construction, vegetation loss, road expansion – all easy to track visually.
- Object detection in open environments: Buildings, vehicles, land boundaries, and other surface features stand out clearly.
- Quick anomaly checks: If something unusual is detected elsewhere, RGB often helps confirm or reject it fast.
- Training AI models: It’s the standard input for most object detection and segmentation algorithms.
- Fast turnaround use cases: RGB is lightweight and delivers insights without long processing pipelines.
When Other Sensors Make More Sense
That said, RGB isn’t built for everything. It can’t penetrate cloud cover, it doesn’t detect temperature or water content, and it’s limited to daylight hours. That’s where radar, infrared, or hyperspectral instruments come in – especially for climate monitoring, agriculture, or high-risk terrain.
Other EO sensors are better suited for:
- All-weather, 24/7 observation: SAR works through clouds and darkness, making it ideal for continuous monitoring.
- Surface heat or moisture mapping: Thermal and infrared sensors are essential for early warnings and crop insights.
- Material or chemical identification: Hyperspectral imaging helps detect specific substances or stress markers.
- Pre-disaster risk analysis: Radar is great for spotting shifts in terrain or structures before visible damage occurs.
- Tropical or cloud-heavy zones: Where optical fails, radar keeps the data flowing.
It’s Not a Competition
RGB isn’t here to replace other sensors – it complements them. For many workflows, it’s the first step toward context, mapping, or automation. But blending RGB with other data sources is what really unlocks high-confidence decisions, especially when conditions on the ground get more complex.
From Raw Images to Decisions: The Role of AI in EO Infrastructure
Satellite imagery alone doesn’t solve infrastructure problems. What matters is what you can extract from it – and how fast. That’s where AI shifts the entire equation. Instead of manually reviewing hundreds of RGB frames, operators now run automated detection pipelines that flag changes, classify objects, and surface relevant patterns without having to sift through noise.
For infrastructure monitoring, this means actionable outputs instead of passive images. AI models trained on real-world examples can spot new construction, track material stockpiles, detect encroachment near power lines, or highlight areas of concern along roads or pipelines – all without waiting for field reports. And once those models are tuned, they scale easily. You can apply the same logic across multiple cities, assets, or regions, with minimal human input.
The shift isn’t just about speed – it’s about visibility. When AI turns pixels into data points, teams get structured insights that can plug directly into dashboards, GIS layers, or planning tools. It’s not just “what does the image show” – it becomes “what’s changing, where, and should we act on it?” That’s the gap AI fills: it connects raw Earth Observation data to real infrastructure decisions, without bottlenecks.
Who Uses RGB-Based Earth Observation Today
RGB imaging is still one of the most widely used data layers in Earth Observation – not because it’s the most advanced, but because it works. It’s fast to interpret, easy to integrate, and gives immediate visual context. Across industries, teams use it to track assets, monitor activity, and flag changes before they become problems.
Key users of RGB-based EO today include:
- Construction and engineering firms: Use RGB to track site progress, monitor changes in nearby terrain, and detect unexpected activity around infrastructure zones.
- Energy and utility companies: Rely on RGB data to inspect power lines, solar installations, and substations, especially over large or remote areas.
- Municipalities and urban planners: Analyze land use, road networks, and urban sprawl using time-series RGB imagery to support zoning and development decisions.
- Insurers and risk analysts: Use before-and-after RGB layers for damage assessment, claim validation, and planning around high-risk areas.
- Forestry and agriculture teams: Monitor visible changes in vegetation, detect illegal clearing, and track seasonal cycles.
- Logistics and port operators: Visualize supply chain movement, container volume, and storage activity at high-traffic hubs.
In most cases, RGB isn’t the only layer being used – but it’s often the first. It sets the baseline for spatial awareness, and with the right tools, it scales easily across entire networks or regions.
Limits and Realities of RGB Satellite Data
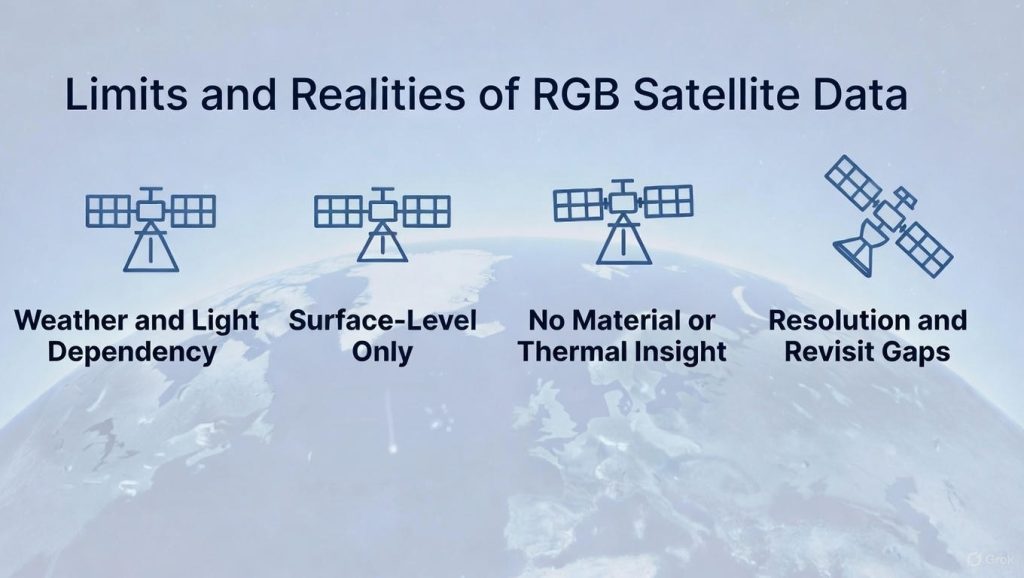
RGB is often the starting point for Earth Observation – but like any tool, it has boundaries. Knowing where those limits are helps avoid false confidence and ensures that the right data source is used for the job.
1. Weather and Light Dependency
RGB sensors rely on sunlight and a clear view of the ground. That means no night-time imaging, and no data when there’s heavy cloud cover. In tropical or high-latitude regions, this can leave long gaps in monitoring, especially during rainy seasons. Optical blackout isn’t rare – it’s something every workflow has to account for.
2. Surface-Level Only
RGB only shows what’s visible from above. It doesn’t penetrate tree canopies, walls, or rooftops. You’ll see that a structure exists – but not whether it’s damaged, active, or partially collapsed inside. For forestry, urban analysis, or disaster response, that surface-level perspective can be both useful and limiting.
3. No Material or Thermal Insight
With RGB, there’s no way to tell heat, moisture content, or chemical composition. A roof and a parking lot might look similar in color, but behave very differently under stress. For tasks like fire detection, crop health monitoring, or environmental hazard detection, RGB simply doesn’t go deep enough.
4. Resolution and Revisit Gaps
Commercial RGB imagery varies in quality. Some sources offer daily high-res shots, others deliver lower-res or sparse updates. If you need consistent monitoring at tight intervals or zoomed-in details of small features, not all RGB sources will cut it. Matching sensor specs to your task still matters.
The Future of RGB in Space Infrastructure Monitoring
RGB isn’t going anywhere. If anything, it’s getting a second life – not because the sensors are changing, but because the way we use them is. With more satellites launching every month, revisit times are dropping, and coverage is getting dense enough to treat RGB as a near-real-time feed. That shift alone turns simple visual data into something that feels more like a stream than a snapshot.
What’s pushing RGB forward isn’t just volume – it’s automation. As object detection, segmentation, and change tracking models get sharper, RGB becomes a trigger layer for deeper workflows. It can flag something worth investigating before radar or thermal even enters the picture. And when paired with archives, it enables infrastructure teams to rewind and pinpoint when something shifted, not just that it did.
Even in a sensor-rich future, RGB holds its role as the eyes of Earth Observation. It brings context, clarity, and compatibility with almost every modern tool in the EO stack. The future isn’t about replacing RGB – it’s about making it smarter, faster, and more connected to how decisions actually get made on the ground.
Conclusion
RGB imaging still does a lot of the heavy lifting in space-based infrastructure monitoring. It’s straightforward, reliable, and easy to plug into automated systems that flag changes and track activity. Even as more advanced sensors join the mix, RGB remains the first layer many teams turn to when they need fast, visual context on what’s happening across roads, energy sites, ports, or urban zones.
The future isn’t about replacing RGB – it’s about giving it better tools, smarter processing, and tighter integration into decision-making. With shorter revisit times, stronger AI models, and cleaner interfaces, that’s already starting to happen. What used to be just “satellite photos” is now a dynamic input into real workflows, scaling far beyond what manual methods can handle. RGB might be simple, but it’s far from basic.
FAQ
It captures visible light in red, green, and blue – basically what the human eye sees. It’s great for spotting surface-level features like buildings, roads, and vegetation changes.
In many cases, yes. It’s used daily in construction tracking, power line inspection, and road maintenance. But it’s often combined with AI or layered with other sensor types to go deeper.
It doesn’t work well through clouds or at night, and it can’t detect things like heat, moisture, or chemical makeup. It’s a surface-level view – fast and clear, but limited in depth.
That depends on the satellite provider, but some commercial constellations offer daily or near-daily updates over key regions. Revisit frequency is getting better each year.