

Farmers and researchers can access free satellite imagery from authoritative sources including USGS Landsat (50+ years of archive), ESA’s Sentinel satellites (10m resolution, updated every 5 days), NASA Earthdata for specialized products, and NOAA for coastal and atmospheric data. These platforms provide multispectral, SAR, and thermal imagery essential for crop monitoring, land use analysis, and environmental research without subscription costs.
Satellite imagery has transformed how agricultural professionals and researchers monitor crops, assess land health, and make data-driven decisions. The good news? Access to high-quality satellite data doesn’t require expensive subscriptions.
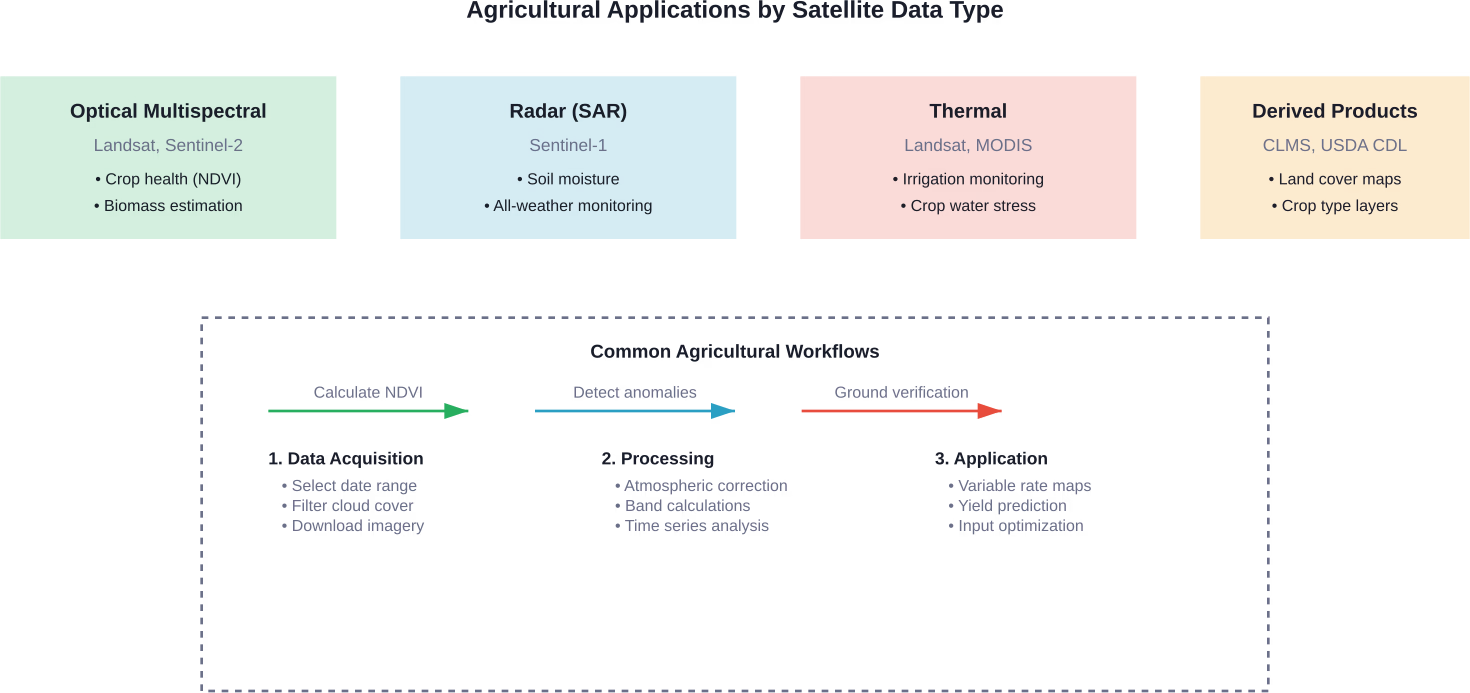
Multiple government agencies and international organizations provide free earth observation data suitable for precision agriculture, environmental monitoring, and scientific research. These platforms deliver multispectral optical imagery, synthetic aperture radar (SAR), thermal data, and derived products like vegetation indices.
Here’s a comprehensive look at the most valuable free satellite imagery sources available today.
USGS EarthExplorer: The Gold Standard Archive
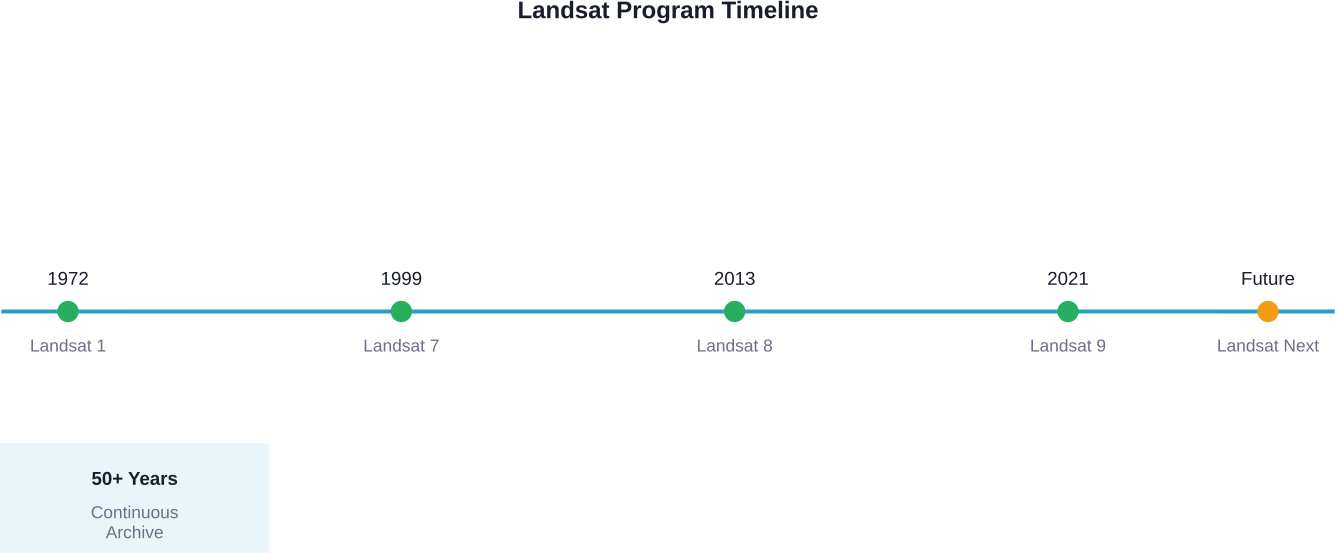
The U.S. Geological Survey operates EarthExplorer, providing access to the world’s longest continuous earth observation record. The Landsat Program, jointly managed by NASA and USGS since 1972, forms the backbone of this archive.
Currently, Landsat 8 and Landsat 9 satellites orbit Earth, capturing imagery with 30-meter resolution across multiple spectral bands. According to USGS, Landsat scenes become available through EarthExplorer within 6 hours after acquisition—remarkably fast for free data.
The platform includes more than 50 years of historical imagery, making it invaluable for long-term land use studies. Researchers analyzing agricultural expansion, deforestation, or urban growth rely heavily on this temporal depth.
Key datasets available:
- Landsat 1-9 optical imagery (1972-present)
- Global Land Cover Characterization derived from AVHRR data
- Aerial photography collections
- Declassified intelligence satellite imagery
- Digital elevation models
For farmers, Landsat’s thermal bands enable soil moisture assessment and irrigation monitoring. The 16-day revisit cycle provides regular updates, though cloud cover can limit usability in some regions.
Copernicus Sentinel Satellites: High-Resolution European Data
The European Space Agency’s Copernicus program delivers some of the highest-resolution free satellite imagery available. Sentinel-2 satellites provide 10-meter resolution multispectral imagery, updated approximately every 5 days for any location on Earth.
For agricultural applications, this frequent revisit schedule proves invaluable. Farmers can track crop development throughout the growing season, detect stress before it becomes visible to the naked eye, and optimize input applications.
According to Copernicus’ success stories published in January 2026, xarvio’s digital farming platform uses Sentinel-2 data to serve over 130,000 farmers globally managing over 20 million hectares. Field validations across 25 farms in Germany covering 1,400 hectares demonstrated measurable yield increases of approximately 5% in high-biomass zones alongside input savings of up to 25% in low-biomass zones.
Sentinel-1 satellites provide radar imagery that penetrates clouds—a critical advantage in regions with persistent cloud cover. SAR data enables soil moisture estimation and flood mapping regardless of weather conditions.
Access points include:
- Copernicus Data Space Ecosystem (primary portal)
- Copernicus Browser for quick visualization
- Sentinel Hub APIs for developers
The Copernicus Land Monitoring Service offers processed products including vegetation phenology, water bodies, and land cover classifications—saving researchers significant processing time.
NASA Earthdata: Specialized Scientific Products
While USGS handles Landsat distribution, NASA Earthdata provides access to hundreds of other earth science datasets. This platform excels at offering derived products rather than raw imagery.
NASA’s MODIS sensors deliver coarser spatial resolution (250-500 meters) but exceptional temporal resolution—multiple daily observations. For regional-scale agricultural monitoring, MODIS vegetation indices remain widely used.
NASA Worldview deserves special mention for its real-time visualization capabilities. The platform displays scientific data layers including active fires, aerosols, and snow cover within hours of satellite observation.
FIRMS (Fire Information for Resource Management System) provides near real-time active fire detection—critical for agricultural regions facing wildfire threats. Data becomes available within 3 hours of satellite overpass.
| Platform | Resolution | Revisit Time | Best Agricultural Use |
|---|---|---|---|
| Landsat 8/9 | 30 meters | 16 days | Field-level analysis, irrigation |
| Sentinel-2 | 10 meters | 5 days | Crop health, biomass monitoring |
| Sentinel-1 | 10 meters | 6 days | All-weather monitoring, soil moisture |
| MODIS | 250-500 meters | Daily | Regional trends, phenology |
NOAA Data Services: Coastal and Atmospheric Focus
The National Oceanic and Atmospheric Administration specializes in oceanic and atmospheric data, but offers valuable resources for agricultural researchers—particularly those working in coastal regions.
NOAA’s Data Access Viewer provides coastal imagery, LiDAR elevation data, and land cover products. For farms near coastlines or major water bodies, these datasets support drainage planning and flood risk assessment.
The NOAA CLASS system archives data from GOES weather satellites and polar-orbiting environmental satellites. While primarily designed for meteorology, this imagery supports agricultural applications including frost prediction and storm damage assessment.
NOAA’s global climate data complements satellite imagery by providing the environmental context needed to interpret land surface changes.
Specialized Agricultural Platforms
Beyond general earth observation platforms, some services target agricultural users specifically.
USDA CropScape provides a web-based tool for exploring crop-specific data layers derived from satellite imagery. The Cropland Data Layer classifies agricultural land use annually across the United States at 30-meter resolution.
JAXA’s ALOS World 3D (AW3D30) provides global digital surface models at 30-meter resolution—useful for understanding topography’s influence on water flow and erosion in agricultural landscapes.
Practical Considerations for Agricultural Use
Understanding satellite data requires recognizing limitations alongside capabilities. Cloud cover remains the primary obstacle for optical sensors like Landsat and Sentinel-2. During the growing season in humid climates, finding cloud-free imagery can prove challenging.
That’s where SAR data shines. Sentinel-1’s radar signals penetrate clouds, providing consistent monitoring regardless of weather. For operations requiring guaranteed data availability, combining optical and radar sources delivers reliability.
Spatial resolution determines which applications are feasible. A 30-meter Landsat pixel covers roughly 0.22 acres—adequate for large commercial fields but marginal for smaller plots or precision applications within fields. Sentinel-2’s 10-meter resolution improves this to about 0.025 acres per pixel.
Temporal resolution—how often satellites revisit the same location—impacts change detection capabilities. Rapid crop development during peak growing season can be missed with infrequent observations. Combining multiple satellite sources increases effective revisit frequency.
Getting Started: Registration and Access
Most platforms require free registration. USGS EarthExplorer, NASA Earthdata, and Copernicus Data Space Ecosystem all use simple account creation processes requiring only email verification.
Download formats vary by platform. GeoTIFF remains standard for imagery, while metadata comes as XML or JSON. Processing typically requires GIS software like QGIS (free) or commercial options like ArcGIS.
For researchers without remote sensing expertise, browser-based visualization tools provide entry points. Copernicus Browser and NASA Worldview allow imagery exploration without downloads or specialized software.
Community discussions on platforms like Reddit reveal mixed perspectives on tools reducing technical barriers, with some users appreciating simplified interfaces while others express concerns about analytical rigor. Browser-based platforms with pre-calculated vegetation indices enable agronomists to leverage satellite data without becoming remote sensing specialists.
Real-World Agricultural Applications
Precision agriculture represents the most direct application of free satellite imagery. Variable rate application maps guide equipment to apply fertilizers, pesticides, or irrigation precisely where needed—reducing costs and environmental impact.
Crop health monitoring through vegetation indices detects stress days or weeks before symptoms become visible. Early detection enables interventions that preserve yield.
Field boundary mapping using high-resolution imagery supports subsidy applications and land management documentation. Historical imagery proves invaluable for verifying land use history.
Research applications span crop yield prediction, climate impact studies, and land use change analysis. California’s agriculture industry, valued at approximately $55.9 billion in 2023, benefits from satellite-derived data including groundwater monitoring applications.
Wildfire risk mapping combines vegetation data with weather information to protect agricultural assets. Australia’s fire preparedness systems, strengthened by Sentinel-2 data according to November 2025 reports, demonstrate how satellite monitoring saves lives and property.
Make Free Satellite Imagery Actually Useful
Free satellite imagery is easy to access, but turning raw images into something usable is the harder part. FlyPix AI focuses on analyzing satellite, drone, and aerial data with AI – helping detect objects, track changes over time, and highlight patterns that are difficult to spot manually. It also supports no-code model training, so teams can adapt the analysis to their own farming or research needs without technical setup.
For farmers and researchers, this means moving beyond just viewing images and actually working with them – monitoring land, spotting changes, and making decisions based on real data. If you’re already using free satellite sources, it’s worth reaching out to the FlyPix AI team to see how their platform can help you get practical value from that data.
Conclusion
Free satellite imagery has democratized access to earth observation data. Farmers managing hundreds of acres and researchers studying global agriculture now access the same government-provided data that was once restricted or prohibitively expensive.
The platforms covered here—USGS EarthExplorer, Copernicus Sentinels, NASA Earthdata, and NOAA services—provide comprehensive coverage suitable for virtually any agricultural or research application. Start with the platform matching your resolution and revisit requirements, then expand to additional sources as needs grow.
The combination of optical, radar, and thermal sensors delivers insights impossible to obtain through ground observation alone. As satellite constellations expand and processing tools become more user-friendly, the gap between space-based data collection and field-level decision-making continues narrowing.
Begin exploring these resources today. Your next breakthrough in crop management or research might be waiting in freely available satellite imagery captured yesterday.
Frequently Asked Questions
Sentinel-2 provides the highest resolution free satellite imagery at 10 meters for most bands. Landsat offers 30-meter resolution as standard, with 15-meter panchromatic resolution. For disaster events, Maxar’s Open Data Program releases high-resolution optical imagery (sub-meter resolution) within 24-48 hours of disaster events, though coverage is event-specific rather than continuous.
Update frequency varies by satellite. Sentinel-2 revisits every 5 days, Landsat every 16 days, and MODIS daily. According to USGS, Landsat scenes become available through EarthExplorer within 6 hours of acquisition. Combining multiple satellites increases effective revisit frequency for any location.
Yes. Data from USGS Landsat, ESA Copernicus Sentinels, and NASA satellites carries no commercial use restrictions. These platforms explicitly permit commercial applications including precision agriculture services, crop consulting, and farm management software. Always verify specific terms for each dataset.
Not necessarily. Browser-based platforms like Copernicus Browser and NASA Worldview allow visualization without downloads. For analysis, free software like QGIS handles most satellite data formats. Many platforms now offer pre-processed products like vegetation indices, reducing technical requirements.
Cloud cover limits optical satellite usefulness. Strategies include downloading multiple dates to find cloud-free periods, using Sentinel-1 radar data that penetrates clouds, or working with composite products that combine multiple cloud-free observations. Time series analysis can often work around occasional cloudy images.
Landsat and Sentinel-2 support all common vegetation indices including NDVI (Normalized Difference Vegetation Index), EVI (Enhanced Vegetation Index), NDWI (Normalized Difference Water Index), and SAVI (Soil-Adjusted Vegetation Index). These reveal crop health, water stress, and biomass. Many platforms provide pre-calculated indices.
Yes. USGS EarthExplorer provides Landsat imagery dating to 1972—over 50 years of continuous earth observation. This historical archive enables long-term land use change studies, making it invaluable for research into agricultural expansion, climate impacts, and environmental changes over decades.