
")
Quick Summary: AGMRI by IntelinAir is a precision agriculture platform that transforms aerial imagery from satellites, drones, and airplanes into actionable crop intelligence. The tool provides season-long field monitoring, automated alerts for crop stress, weed pressure, nutrient deficiencies, and disease risk, plus post-season analytics and yield forecasting to help growers and agronomists make confident, data-driven management decisions across their operations.
Managing crop production across hundreds or thousands of acres presents a challenge that’s gotten more complex each season. Which fields need immediate attention? Where are yield-threatening issues developing? What’s the ROI on that second fungicide pass?
AGMRI addresses these questions head-on. According to the official website, IntelinAir is an imagery and analytics provider helping growers prioritize acres through regular alerts and reporting. The platform doesn’t just deliver images—it transforms aerial data into actionable intelligence for mission-critical agricultural decisions.
What Is AGMRI?
AGMRI is IntelinAir’s cloud-based precision agriculture platform that analyzes high-resolution aerial imagery to monitor crop health, detect field issues, and forecast yields throughout the growing season.
The service offers subscription-based access to aerial imagery sourced from three capture methods: high-resolution satellite (30 cm to 150 cm resolution), drone imagery (≤15 cm resolution), and fixed-wing airplane captures (≤15 cm resolution). Subscribers receive multiple imagery captures from early spring through early September, according to the official FAQ.
But here’s the thing—AGMRI isn’t just an image viewer. The platform applies proprietary algorithms and machine learning models to automatically identify agronomic issues and deliver prioritized alerts, so agronomists and growers can focus their scouting efforts where they’ll make the biggest impact.
Core Platform Features
AGMRI organizes its capabilities around season-long field monitoring and post-season analytics, with tools designed for scalability whether managing a single operation or servicing customers across wide geographies.
Agronomic Field Insights
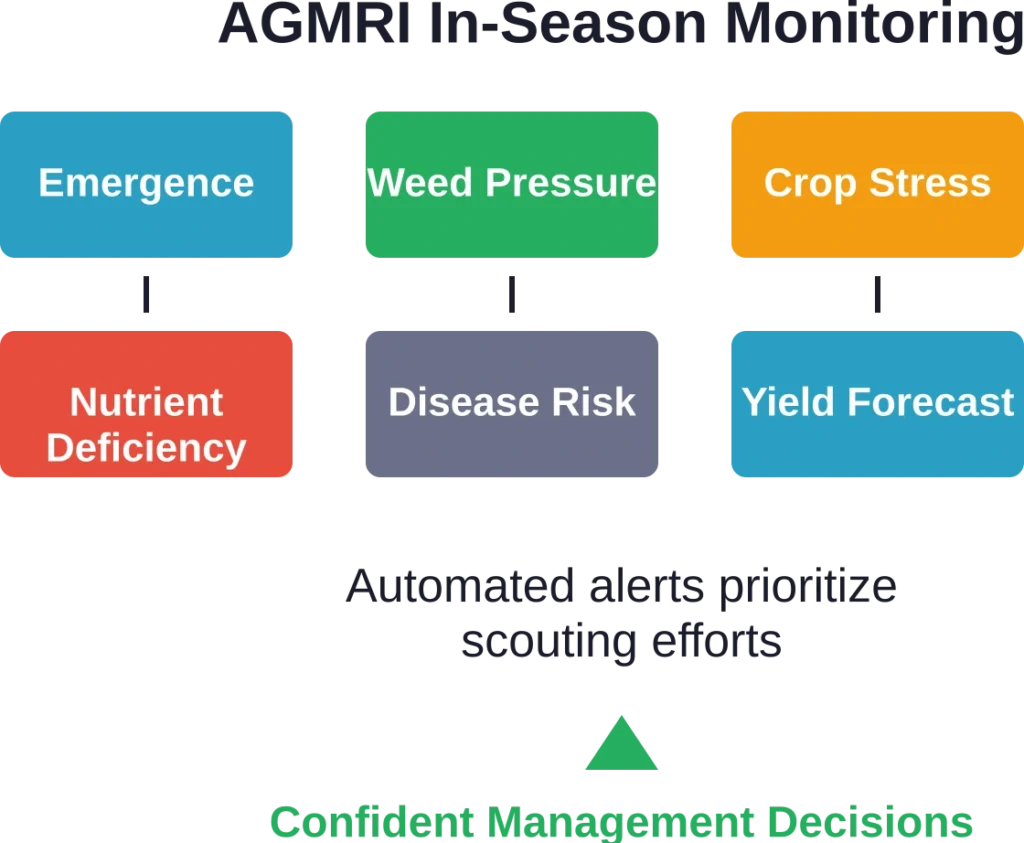
The platform provides in-season scalable insights covering key production variables. These automated alerts help users confidently cover acres without physically walking every field.
AGMRI monitors and flags:
- Emergence issues: Early-season stand establishment problems that might require replanting decisions
- Weed pressure: Detection of weed escapes following herbicide applications
- Crop stress: Identification of areas experiencing environmental or pest pressure
- Nutrient deficiency: Visual signatures indicating nitrogen, potassium, or other nutrient limitations
- Disease risk: Environmental condition tracking that forecasts disease pressure in corn and soybean fields
- Yield forecast: Mid-to-late-season yield estimates to inform marketing and logistics planning
Interactive Maps and Dashboard
The personalized dashboard lets users customize their view by choosing alerts and homepage widgets that match their priorities. Fields display with color-coded zones indicating areas requiring attention.
Users can quickly scan fields through a map interface that layers multiple data types—NDVI crop health analytics, stress indicators, and historical performance comparisons. The interactive maps support zooming into specific problem areas and generating scouting assignments directly from flagged zones.
Field Scouting Tools
AGMRI elevates scouting programs through digital workflow management. According to the official website, users can efficiently assign, track, and share scouting activities throughout the growing season.
The scouting tool allows agronomists to:
- Create scouting tasks based on automated alerts
- Assign specific zones or fields to team members
- Record observations with photos and notes
- Track completion status across operations
- Share findings with growers and stakeholders
This digital coordination replaces clipboard-and-spreadsheet workflows, ensuring consistent documentation and faster communication when time-sensitive issues emerge.
Post-Season Analytics (Analyze)
Analyze is AGMRI’s post-season analytics module that informs next year’s decisions through unique views of the completed season. The platform provides insights into factors that impact yield, including emergence patterns, crop input product performance, weather effects, and other management practices.
This retrospective analysis helps operations identify what worked and what didn’t, building institutional knowledge across seasons rather than relying on memory and anecdotal observations.
Advanced Capabilities
Many growers know AGMRI for basic field monitoring. But the platform supports capabilities that extend well beyond simple imagery review.
Disease Risk Forecasting
AGMRI tracks environmental conditions throughout the season to identify and forecast disease risk in corn and soybean fields. The system monitors temperature, humidity, leaf wetness, and other factors that contribute to disease pressure, providing early warnings before visual symptoms appear in the field.
In a documented use case, a farm manager used AGMRI’s nutrient deficiency and disease pressure layers in combination with crop stage data to make a confident fungicide decision. By analyzing the data, the grower narrowed the decision to a single field out of six that showed confident probability of positive ROI with a second fungicide pass. The analysis guided a targeted application that avoided unnecessary costs on the other five fields.
Precision Zoning Tool
Released as a platform enhancement, the Precision Zoning Tool enables users to generate customized zoning maps for variable rate applications throughout the season. Using NDVI analytics, the tool automatically segments fields into zones based on potential crop productivity.
These zones support informed decisions about input applications—how much, where, and when—to address field variability. The tool exports zone maps in formats compatible with precision application equipment.
Yield Estimation
The Yield Estimate Scouting Tool helps operations forecast production before harvest. AGMRI’s yield forecast model analyzes crop development patterns, stress events, and historical performance to project end-of-season yields at the field level.
These forecasts inform marketing decisions, storage planning, and logistics coordination. They also provide early indication of fields underperforming expectations, allowing investigation into root causes.

Review Crop and Field Conditions with FlyPix AI
AGMRI by Intelinair is focused on agricultural intelligence, field monitoring, and crop condition insights. FlyPix AI can support similar image-based work by analyzing satellite, drone, and aerial imagery to detect objects, review land patterns, and track visible changes across farms or large field areas.
FlyPix AI can help agriculture teams work with visual field data through tasks such as:
- Reviewing crop areas, vegetation patterns, and field boundaries
- Detecting visible changes, gaps, objects, or surface conditions
- Comparing field imagery across different dates
- Building custom AI models for specific crop or land monitoring needs
Contact FlyPix AI to explore how geospatial imagery analysis can support crop and field monitoring.
Real-World Application
Data analysis capabilities matter most when they solve actual production challenges. AGMRI’s approach focuses on turning complex data into actionable insights during critical decision windows.
The platform addresses a fundamental problem: farmers and agribusinesses face overwhelming amounts of data from soil health, crop performance, weather patterns, and market trends. Without proper analytical tools, that data creates noise rather than clarity.
AGMRI bridges this gap by transforming raw information into directed recommendations. The system doesn’t just show where crop stress exists—it quantifies severity, suggests causes, and prioritizes which fields warrant immediate intervention versus continued monitoring.
This predictive capability separates reactive management from proactive planning. Instead of discovering problems after yield loss occurs, operations receive early warnings when interventions still deliver ROI.
Platform Access and Integration
AGMRI operates as a cloud-based subscription service accessible through web browsers and mobile applications. The mobile app (available on iOS through the App Store) allows field-level access to imagery, alerts, and scouting tools without requiring desktop computer access.
The platform supports integration with other precision agriculture systems, allowing data exchange with farm management software, equipment systems, and external data sources. These integrations enable AGMRI insights to flow into existing operational workflows rather than requiring separate standalone processes.
Who Benefits Most?
AGMRI serves multiple segments within agricultural production:
- Row crop growers managing significant acreage benefit from the scalability of automated monitoring. The platform allows oversight of hundreds or thousands of acres without proportionally increasing scouting labor.
- Agronomists and crop consultants serving multiple client operations use AGMRI to efficiently monitor client fields, prioritize site visits, and document recommendations with supporting imagery and data.
- Agricultural retailers and cooperatives leverage the platform to provide value-added services to grower customers, differentiating their agronomic support with data-driven recommendations.
The common thread: operations that need to make confident decisions across scale, where time and labor constraints prevent walking every acre but crop value demands attentive management.
Frequently Asked Questions
AGMRI focuses primarily on corn and soybean production, with disease risk models, nutrient deficiency detection, and yield forecasting optimized for these row crops. The imagery and basic crop health monitoring work across other crop types, but the specialized analytics target corn and soybean operations.
According to the official FAQ, AGMRI subscribers receive multiple imagery captures during the crop season from early spring through early September. The specific frequency depends on weather conditions (cloud cover affects satellite capture), subscription level, and regional service parameters. Check with IntelinAir for current capture schedules in specific growing regions.
Yes, AGMRI supports integrations with precision agriculture platforms and farm management systems. The platform can exchange field boundary data, export zone maps for variable rate applications, and share agronomic insights with compatible systems. Specific integration capabilities vary—consult the official documentation for current integration partners and data exchange formats.
AGMRI analyzes imagery from three sources: high-resolution satellite (30 cm to 150 cm resolution), drone captures (≤15 cm resolution), and fixed-wing airplane flights (≤15 cm resolution). The platform combines data from multiple sources to maintain consistent coverage despite weather interruptions that might ground aircraft or obscure satellite views.
The Precision Zoning Tool generates zoning maps that can inform variable rate prescriptions. These maps segment fields into productivity zones based on NDVI analytics. Users can export these zones in formats compatible with precision application equipment, though the platform focuses on identifying zones rather than prescribing specific input rates—that agronomic interpretation remains with the user.
AGMRI tracks environmental conditions including temperature, humidity, and leaf wetness throughout the growing season. The platform compares these conditions against disease development models for common corn and soybean diseases, generating risk forecasts before visual symptoms appear. This early warning supports proactive fungicide timing decisions rather than reactive applications after infection establishes.
Raw satellite imagery shows visual differences across fields but requires expertise to interpret and doesn’t scale across large operations. AGMRI applies proprietary algorithms and machine learning to automatically identify specific agronomic issues (weed pressure, nutrient deficiency, disease risk, yield potential), quantify their severity, and generate prioritized alerts. This transforms imagery viewing into actionable decision support.
Making Data Work for Production
Precision agriculture technology succeeds when it reduces complexity rather than adding to it. AGMRI’s approach—automated analysis delivering prioritized alerts—aligns with that principle.
The platform won’t walk fields or make management decisions. What it does is focus limited scouting resources on acres most likely to benefit from intervention, quantify issues to support confident treatment decisions, and document season-long performance to inform future planning.
For operations managing scale where every field can’t receive daily attention, that prioritization capability translates directly into better resource allocation. Time spent investigating flagged issues tends to find problems worth addressing. Time saved avoiding scouting healthy acres compounds across hundreds of fields and multiple team members.
Check AGMRI’s official website for current subscription options, regional availability, and specific feature details for the current crop season. Platform capabilities continue evolving—what’s described here reflects functionality based on available source materials.