
Maps have always been my go-to for understanding the world. Whether I’m planning a road trip or checking satellite images to see how my hometown has changed, there’s something fascinating about how data brings places to life. Geospatial data is the backbone of these maps, tying specific information to locations on Earth. From pinpointing a local bakery to tracking wildfire patterns, geospatial data helps us make sense of the world in practical ways. In this guide, I’ll walk you through the core types of geospatial data – vector, raster, and geotemporal – and dig into other essential formats like points of interest, property, and mobility data. By the end, you’ll have a clear picture of how these data types work and why they matter for businesses, planners, and curious minds alike. Let’s dive in!
The Core Geospatial Data Types
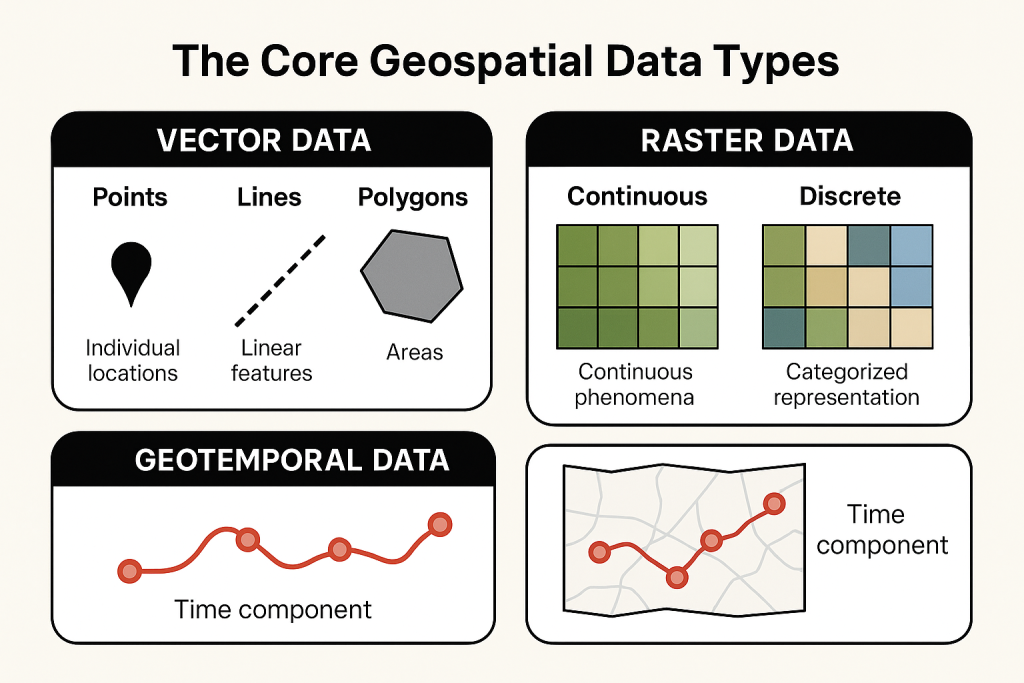
Let’s dive into the big three: vector, raster, and geotemporal data. These are the heavyweights that form the backbone of most geospatial applications, each offering a unique way to represent and understand the world around us. Whether you’re mapping a city, analyzing weather patterns, or tracking changes over time, these data types are the starting point for turning raw location-based information into actionable insights. They’re like the primary colors of geospatial work-each distinct, but often blended to create something even more powerful.
1. Vector Data: Points, Lines, and Polygons
Vector data feels like sketching a blueprint with crisp, clean lines. It represents features with distinct boundaries using points, lines, and polygons. Picture a map of your city: a dot marks your go-to coffee shop (a point), a line traces the highway you drive to work (a line), and a shaded area outlines the city limits (a polygon). Its precision and scalability make vector data a favorite for apps like Google Maps-you can zoom in endlessly without losing sharpness. This clarity is a big win for creating detailed, user-friendly maps.
- Point Data: These zero-dimensional markers pinpoint spots like schools, gas stations, or even a lone tree in a park. They’re ideal for flagging specific locations but won’t tell you about size, shape, or area. Think of them as pushpins on a map-great for marking, less so for measuring.
- Line Data: Imagine rivers, roads, or railway tracks snaking across a map. These one-dimensional features capture length but not width, using styles like dashed lines or bold colors to stand out. A blue line might show a river, while a red dashed line could mark a hiking trail.
- Polygon Data: These two-dimensional shapes define areas like lakes, forests, or neighborhoods. They’re perfect for calculating metrics like area or perimeter, helping planners understand the scope of a region. For example, a green polygon might highlight a national park, while a gray one shows an urban district.
Vector data is a powerhouse for industries like urban planning, logistics, or even real estate, where accuracy is everything. A delivery company might rely on line data to plot the quickest routes or use polygon data to carve out delivery zones with surgical precision. It’s also handy for city planners mapping infrastructure or zoning areas. The catch? Vector data struggles with complex, continuous phenomena like elevation changes or temperature gradients, where smooth transitions are key. For those, you need a different tool in the geospatial toolbox.
2. Raster Data: Pixels and Grids
If vector data is a blueprint, raster data is like a high-res photograph capturing the world’s details. It divides the Earth into a grid of cells, each holding a value that represents something specific-like elevation, temperature, or land cover. Think of satellite images or topographic maps where every pixel tells a story. Raster data comes in two main types, each suited to different needs:
- Continuous Data: This type captures gradual changes across a landscape, like elevation above sea level or temperature variations over a region. Each cell in the grid holds a unique value, creating a smooth gradient. For example, a weather map might use continuous data to show how rainfall intensity shifts across a state, with colors fading from light to dark.
- Discrete Data: Here, cells are grouped into distinct categories, like land use types (forest, urban, water). Each category has clear boundaries, making it easier to analyze specific zones. A map might use discrete data to highlight agricultural fields in green and city areas in gray, with no blending between them.
Raster data is a go-to for fields like meteorology, environmental science, and disaster management. A weather app might tap into continuous raster data to display rainfall or heat patterns, helping you decide if you need an umbrella. Disaster response teams use discrete data to map flood-prone areas or wildfire zones, enabling quick, targeted action. The downside? Raster data doesn’t scale well-zoom in too far, and it pixelates, like an old-school video game losing its charm. It’s also data-heavy, requiring robust storage and processing to handle those dense grids.
3. Geotemporal Data: Adding the Time Element
Geotemporal data is where the magic of storytelling comes into play. It takes vector or raster data and adds a time component, showing how locations evolve. Imagine tracking a delivery truck’s route throughout the day using vector-based line data, or watching satellite images of a hurricane’s path over hours with raster data. This type is a game-changer for dynamic applications, like logistics companies monitoring vehicle movements or environmental scientists studying deforestation trends over decades.
What makes geotemporal data so special is its ability to capture change. It’s not just about where something is but how it moves or transforms. For example, a retailer might analyze geotemporal data to see how foot traffic spikes during holiday seasons, helping them decide when to hire extra staff or stock up on inventory. Urban planners could use it to track how a city’s population shifts over time, informing decisions about where to build new schools or transit lines. Even disaster response teams rely on it to monitor real-time events, like the spread of a wildfire or the progression of a flood.
The flip side? Geotemporal data is complex. The time element adds a ton of information, which can strain storage and processing systems. Plus, keeping the data accurate and up-to-date is a challenge, especially for fast-moving scenarios like vehicle tracking or weather events. Still, the insights it offers are worth the effort, especially for anyone looking to understand trends or predict future changes.
Geospatial Analysis with Advanced AI Platforms
We are transforming geospatial analysis by incorporating advanced artificial intelligence to streamline the processing of complex datasets. With our platform, FlyPix AI, we focus on analyzing imagery from satellites, drones, and other aerial sources, enabling us to rapidly identify and map objects within geospatial data. We support a range of data types, including raster for imagery analysis and vector for precise feature delineation, applying our capabilities in fields like environmental monitoring, urban planning, and infrastructure assessment. By leveraging advanced machine learning, we automate tasks such as object detection, change tracking, and anomaly identification, enhancing our efficiency in handling diverse geospatial formats like multispectral imagery or point clouds.

Our platform’s design emphasizes accessibility, allowing us to empower users with minimal technical expertise to train custom models for specific needs, such as classifying land use or monitoring construction progress. We ensure seamless integration with existing GIS systems to maintain compatibility with workflows, while our interactive dashboards provide clear visualizations of results. With our ability to process large datasets quickly, we offer a valuable tool for industries requiring scalable solutions, aligning with the trend of AI-driven geospatial advancements that complement traditional GIS capabilities.
Beyond the Core: Other Key Geospatial Data Types
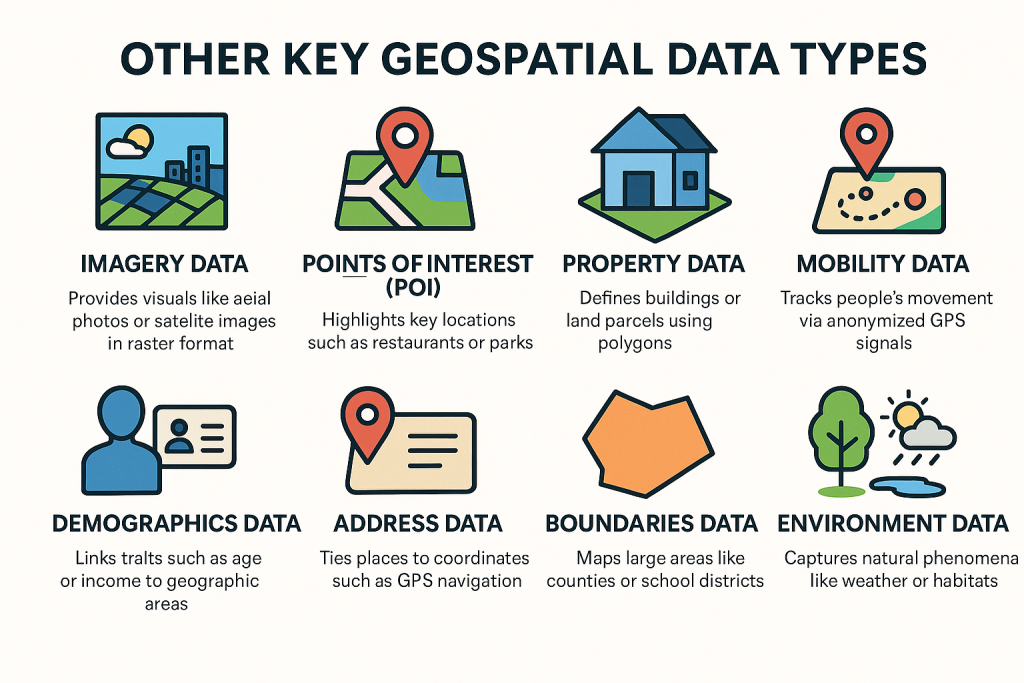
Imagery data brings the world to life through vivid visuals, like aerial photographs or satellite images, always stored in raster format as a grid of pixels. Each pixel captures a piece of the Earth, from sprawling cityscapes to winding ocean currents, offering a snapshot that’s both detailed and breathtaking. It serves as the foundation for basemaps, providing critical context for layering other geospatial data types, making maps more intuitive and informative. Conservationists rely on imagery to monitor environmental changes, such as deforestation patterns or shifts in water quality, helping them protect ecosystems. Urban planners use it to track city growth, spotting new developments or infrastructure needs over time. During crises, disaster response teams turn to satellite imagery to assess damage-hink pinpointing hurricane-ravaged areas to prioritize aid delivery. Despite its stunning clarity, imagery data is a heavyweight, demanding substantial storage and processing power due to its high resolution and large file sizes.
Here’s a quick rundown of the geospatial data types that imagery often complements:
Points of Interest (POI): The Pulse of Places
POI data highlights key locations like restaurants or parks, with details like phone numbers or hours. Unlike basic vector points, it’s rich with info, like a Starbucks’ address and 7 a.m. opening. Retailers use it to pick store spots, real estate firms gauge growth, and healthcare ensures clinic access. A gym chain might check for nearby competitors or transit stops. It’s dynamic, so fresh data is crucial to avoid outdated locations.
Property Data: Defining Physical Spaces
Property data outlines buildings or land parcels with polygons, like malls or lots. Datasets like SafeGraph’s show how units fit within larger structures. Insurers assess risks based on neighbors-a shop by a fireworks store is riskier than one by a bookstore. Retailers track foot traffic; planners ensure zoning compliance. Its precision demands up-to-date records, especially in fast-changing cities.
Mobility Data: Tracking Movement
Mobility data tracks people’s movement via anonymized GPS signals, showing foot traffic patterns like mall visits or commutes. Businesses use it to pick store locations or ad spots, urban planners optimize transit routes, and insurers assess risks like winter accidents. A coffee chain might find a busy corner for a new shop. It reveals trends but requires careful privacy and accuracy handling.
Demographics Data: Understanding People
Demographics data links traits like age or income to geographic areas, often from censuses. Businesses use it to tailor products, like stocking luxury or budget items. City planners ensure services match community needs. A grocery chain might pair it with mobility data to check store viability. Keeping it current is tough as populations change fast.
Address Data: The Foundation of Location
Address data ties places to coordinates, enabling GPS navigation, geocoding, and reverse geocoding. It’s vital for logistics, real estate, and emergency services, linking addresses to data like weather or school districts. A delivery firm might optimize routes with it. Standardizing messy formats like “St.” vs. “Street” is a challenge.
Boundaries Data: Organizing the World
Boundaries data maps large areas like counties or school districts using polygons. Governments use it for taxes or services, businesses for ad placement. A school district might map attendance zones. It’s stable but must be precise for legal or regulatory use.
Environment Data: Nature’s Story
Environmental data captures natural phenomena like weather or wildlife habitats, using vector formats (e.g., polygons for forests) or raster (e.g., storm satellite images). Conservationists track deforestation or migrations, insurers assess flood risks, and farmers monitor soil moisture. A wildfire team might predict a fire’s path using wind and terrain data. It’s vital for understanding Earth but complex to collect due to its vast scale and variability.
Streets Data: The Roads We Travel
Street data maps transportation networks like highways or backroads, including traffic volume or road conditions. GPS apps use it for routing, urban planners ease congestion, and businesses pick high-traffic store locations. A city might add bike lanes based on commuter patterns. Constant updates for construction or closures are a logistical challenge.
Imagery Data: A Bird’s-Eye View
Imagery data provides visuals like aerial photos or satellite images in raster format, capturing cityscapes to oceans. It’s key for basemaps, adding context to other data. Conservationists monitor deforestation, urban planners track growth, and disaster teams assess hurricane damage for aid. Its high resolution requires significant storage and processing power.
The Future of Geospatial Data
Geospatial data is evolving fast. With AI and machine learning, we’re seeing smarter analysis, like predicting traffic patterns or disaster risks with uncanny accuracy. New tech, like drones and autonomous vehicles, is also expanding how we collect and use data. Imagine custom, high-resolution maps created on demand or drones mapping remote areas in real time. It’s exciting to think about how these tools will shape everything from urban planning to conservation.
Conclusion
Geospatial data is more than just dots on a map – it’s a way to understand our world in detail. From the precision of vector data to the vivid imagery of raster data and the dynamic insights of geotemporal data, each type has a role to play. Add in specialized formats like POI, mobility, or environmental data, and you’ve got a toolkit for tackling almost any location-based challenge. Whether you’re a business owner scouting a new location, a planner designing a smarter city, or just curious about the world, geospatial data has something to offer. So next time you open a map, take a moment to appreciate the layers of data bringing it to life – and maybe think about how you could use them yourself.
Frequently Asked Questions
Geospatial data ties information to specific locations on Earth, like coordinates or addresses. It’s crucial for mapping, navigation, urban planning, disaster response, and more, helping us understand and interact with the world in practical ways, from finding a coffee shop to tracking climate changes.
Vector data uses points, lines, and polygons for precise, scalable features like roads or buildings. Raster data uses a grid of pixels to represent continuous data like satellite images or elevation. Vector is great for clarity, while raster excels at showing gradual changes.
Geotemporal data adds a time component to vector or raster data, showing how locations change over time. For example, it can track a delivery truck’s route or monitor a forest’s growth over years, making it ideal for dynamic analysis.
POI data highlights places like restaurants or parks with details like hours or contact info. Businesses use it to choose store locations, real estate firms assess growth potential, and navigation apps guide users to nearby amenities.
Imagery data, stored as raster, provides vivid visuals like satellite or aerial photos. It’s used for basemaps, environmental monitoring (e.g., deforestation), urban planning, and disaster response (e.g., assessing hurricane damage) due to its rich, contextual detail.
Mobility data tracks movement patterns, like foot traffic or commutes, using anonymized GPS signals. Retailers use it to pick high-traffic store locations, urban planners optimize transit routes, and insurers assess risks like accident-prone areas.
Geospatial data can be complex to manage due to large file sizes (especially raster and imagery), the need for frequent updates (e.g., for mobility or POI data), and privacy concerns with movement tracking. Processing and storage demands also require robust systems.