
Resumen rápido: A Web Map Service (WMS) is an OGC standard that lets client applications request georeferenced map images over HTTP from one or more map servers. Implementing WMS means choosing a compliant server, publishing layers with correct coordinate reference systems and styles, and exposing the three core operations—GetCapabilities, GetMap, and GetFeatureInfo—so any WMS-aware client can consume the data.
Anyone who has ever loaded a map layer into QGIS by pasting in a URL has already used WMS without necessarily knowing it. The protocol has been quietly powering interoperable mapping since 1999, and it still shows up everywhere from national spatial data infrastructures to internal GIS dashboards. Implementing it properly, though, trips people up more often than it should—mostly because the spec is old, terse, and written for software engineers rather than analysts.
This guide walks through what WMS actually does, how the core requests fit together, what a real implementation looks like on both server and client sides, and where the standard tends to fall short for teams working with high-resolution imagery or automated analysis pipelines.
What Is a Web Map Service, Exactly?
A Web Map Service is a standard interface, defined by the Open Geospatial Consortium (OGC), that allows a client to request map images generated from geospatial data stored on a remote server. The client doesn’t get raw vector or raster data back—it gets a rendered image, typically PNG or JPEG, with a defined bounding box, coordinate reference system, and set of layers baked in.
That’s the key distinction people miss. WMS produces pictures of maps, not the underlying data. If a workflow needs actual features to query, filter, or edit, that’s a job for WFS (Web Feature Service) or a tile-based alternative, not WMS.
The Three Core Operations
Every compliant WMS implementation, from GeoServer to MapServer to a commercial platform, must support three request types. Understanding these is really the whole ballgame.
GetCapabilities
This is the discovery request. A client sends a simple HTTP GET with the parameter REQUEST=GetCapabilities, and the server responds with an XML document describing every layer it offers, the coordinate systems supported, the available output formats, and the bounding boxes for each layer. Any decent GIS client parses this automatically the moment a WMS URL is pasted in.
GetMap
This is the actual map request—the one that does the heavy lifting. It requires parameters like layer names, a bounding box, a CRS, image width and height, and an output format. Get any of these wrong and the response is either an error or a blank tile, which is usually the first debugging headache newcomers run into.
GetFeatureInfo
Optional but widely supported, this operation lets a client click a point on the rendered map and ask “what’s here?” The server returns attribute data for whatever feature sits at that pixel location. It’s what powers those little popup info boxes in web mapping applications.
| Operation | Required? | Objetivo | Typical Response Format |
|---|---|---|---|
| GetCapabilities | Sí | List layers, formats, CRS support | XML |
| GetMap | Sí | Render and return a map image | PNG, JPEG, GIF |
| GetFeatureInfo | No | Return attribute data for a clicked point | XML, HTML, JSON |

Improve Your WMS Workflow With FlyPix AI
WMS projects often rely on updated raster data from satellite, aerial, and drone imagery. FlyPix AI helps process this imagery, detect objects, classify areas, and prepare geospatial outputs for use in web mapping and GIS workflows.
Working With Raster Data or Map Layers?
FlyPix AI puede ayudar con:
- satellite and aerial image analysis
- detección automática de objetos
- clasificación del uso del suelo
- Entrenamiento de modelos de IA personalizados
👉 Prueba FlyPix AI to process imagery for your web mapping project.
Choosing a Server Implementation
Most teams don’t write a WMS server from scratch—there’s little reason to when mature, well-tested options already exist. The decision usually comes down to hosting environment, licensing preferences, and how much configuration flexibility is needed.
- GeoServer – Java-based, open source, popular for its web admin console and broad format support.
- MapServer – C-based, lightweight, favored where performance under load matters more than a graphical config UI.
- ArcGIS Server / ArcGIS Online – Commercial option, tightly integrated with the Esri ecosystem.
- Cloud-native services – Increasingly, organizations expose WMS endpoints from managed platforms rather than self-hosted servers, trading some configuration control for reduced operational overhead.
Whichever route gets picked, the implementation checklist stays roughly the same: register the data source, define layer names and styles, set the supported CRS list, and verify the capabilities document is well-formed before anything else happens.
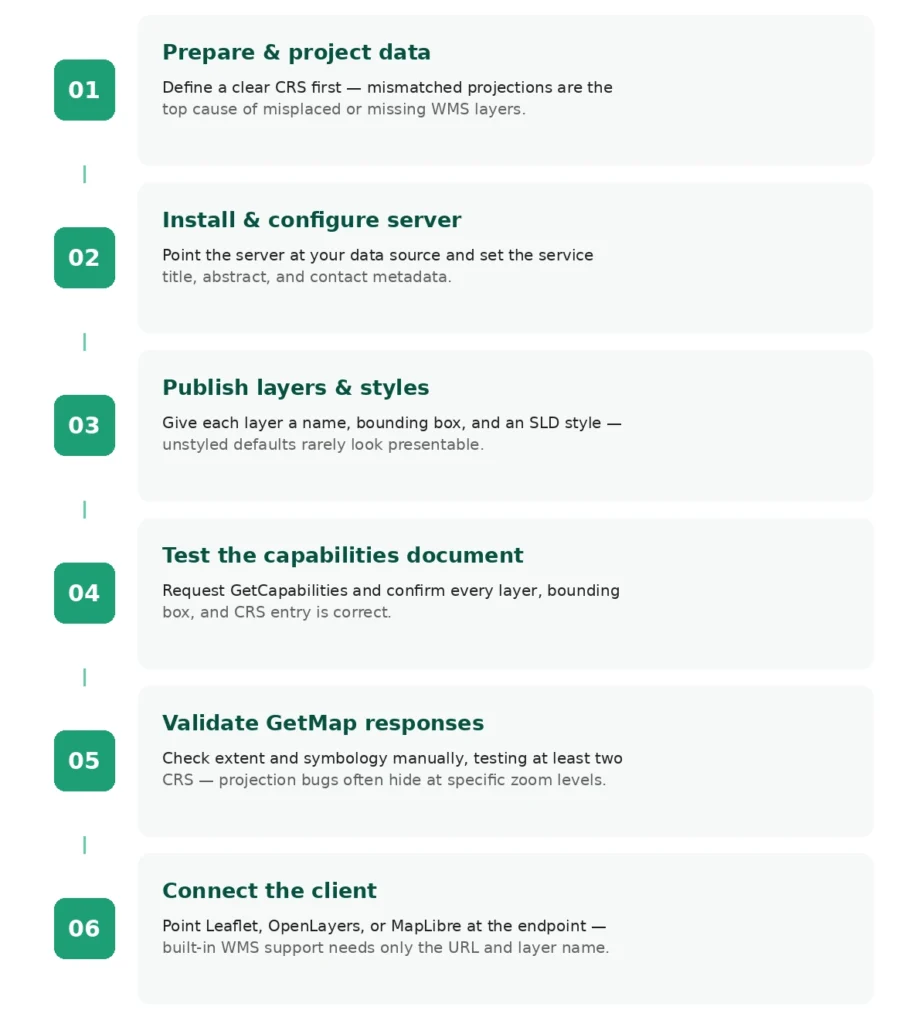
Step-by-Step Implementation Workflow
The order below reflects how most real deployments actually unfold, not the order the specification presents things in.
1. Prepare and Project the Data
Before anything touches a server, source data—whether shapefiles, GeoTIFFs, or a PostGIS table—needs a clearly defined coordinate reference system. Mismatched or missing CRS metadata is probably the single most common cause of WMS layers rendering in the wrong place or not at all.
2. Install and Configure the Server
Set up the chosen server software, point it at a data directory or spatial database, and configure basic settings like the service title, abstract, and contact metadata that will appear in the capabilities document.
3. Publish Layers and Define Styles
Each layer needs a name, a bounding box, and at least one style (often SLD-based) controlling how features render—colors, line weights, symbology for point data, and so on. Skipping styling isn’t fatal, but default renders rarely look presentable.
4. Test the Capabilities Document
Request GetCapabilities directly in a browser and check that every intended layer shows up with correct bounding boxes and supported CRS entries. This step catches most configuration mistakes before a client ever connects.
5. Validate GetMap Responses
Manually construct a GetMap URL with known parameters and confirm the returned image matches expectations—correct extent, correct symbology, no missing tiles. It helps to test at least two different coordinate systems here, since projection bugs often only surface at specific zoom levels.
6. Connect the Client
Point a GIS client, a JavaScript mapping library, or a custom application at the endpoint. Most modern libraries (Leaflet, OpenLayers, MapLibre) have built-in WMS layer support that only needs the base URL and layer name.
Common Implementation Pitfalls
A handful of issues show up again and again across WMS deployments, regardless of which server software is behind them.
- CRS mismatches — requesting a bounding box in a CRS the server doesn’t support for that layer produces distorted or empty images.
- Axis order confusion — WMS 1.3.0 swapped axis order for certain CRS codes compared to 1.1.1, which trips up clients built against the wrong version.
- Overly large GetMap requests — requesting huge image dimensions or too many layers at once can time out or exhaust server memory.
- Missing or stale capabilities caching — clients sometimes cache an old capabilities document, leading to confusing “layer not found” errors after a server update.
- Weak styling defaults — unstyled layers can look fine in testing and terrible once real symbology requirements show up in production.
WMS vs. WMTS vs. WFS
These three OGC services get confused constantly because they all deal with “web” and “map,” but they solve different problems.
| Estándar | Returns | Mejor para | Caching Friendliness |
|---|---|---|---|
| WMS | Rendered map image, custom extent | Flexible, on-demand map views | Low — every request can differ |
| WMTS | Pre-rendered image tiles | Fast, high-traffic tile pyramids | High — tiles are fixed and cacheable |
| WFS | Raw vector features (GML/GeoJSON) | Querying, editing, analysis of features | Low — data-oriented, not image-oriented |
Teams building interactive analysis tools rather than static map viewers often need to go beyond WMS entirely, since a rendered image can’t be queried, filtered by attribute, or fed into a detection model the way raw imagery and vector data can.
Where WMS Fits Into Broader Geospatial Workflows
WMS remains a solid choice for publishing and sharing standardized map layers across organizations, especially in government and infrastructure contexts where interoperability matters more than raw performance. But it’s worth being honest about its limits: WMS delivers a flattened image, not analysis-ready pixels, which makes it a poor fit for workflows that involve automated object detection, change monitoring, or AI-driven image analysis on satellite and drone data.
For that kind of work, platforms built specifically for geospatial image analysis tend to operate closer to the source imagery rather than pre-rendered map tiles, which matters when the goal is detecting objects, measuring change over time, or running custom-trained models across large areas. Organizations evaluating their supported satellite and aerial data formats often find that WMS layers work well as a base map or reference overlay, sitting alongside richer raster analysis rather than replacing it.
Sectors like government infrastructure monitoring, construction site tracking, and agricultural monitoring frequently combine WMS reference layers with dedicated analysis pipelines to get both context and actionable detection results in one interface.
Performance and Scaling Considerations
A WMS endpoint that works fine for a handful of internal users can buckle under public traffic. A few practical levers help:
- Enable server-side tile caching (GeoWebCache, MapProxy) in front of the raw WMS endpoint to reduce redundant rendering.
- Limit the maximum requestable image size and layer count per request.
- Pre-generate simplified geometries for low zoom levels rather than rendering full-resolution vector data every time.
- Monitor request patterns—a small number of heavy, high-resolution requests often account for most server load.
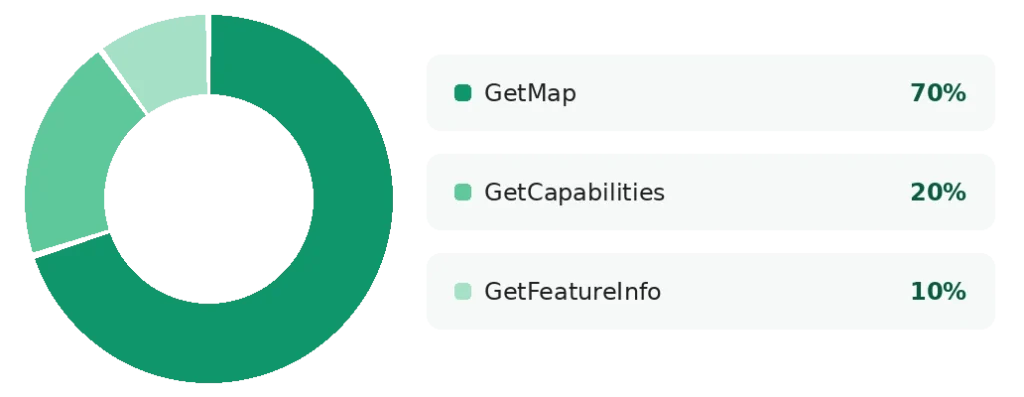
Rough distribution of request types seen on a typical production WMS server.
Security and Access Control
WMS itself has no built-in authentication mechanism—it’s a plain HTTP interface. That said, access control is usually layered on around the service rather than inside the spec:
- Reverse proxy authentication (API keys, tokens, or session cookies) in front of the endpoint.
- Restricting layer visibility per user or role at the server configuration level.
- Rate limiting to prevent scraping or abusive automated requests.
- HTTPS everywhere, especially when sensitive location data is involved.
None of this is exotic, but it’s easy to forget precisely because WMS feels like “just serving images,” which makes it tempting to skip access controls that would be standard on any other data API.
Concluyendo
Implementing WMS well comes down to a short list of fundamentals: clean, correctly projected source data; a properly configured server exposing GetCapabilities, GetMap, and GetFeatureInfo; and a client that respects the version and CRS quirks baked into the standard. None of it is conceptually hard, but the details—axis order, caching, styling—are exactly where most implementations quietly go wrong.
For teams whose needs go beyond static map display into actual detection, measurement, or monitoring across satellite and drone imagery, it’s worth looking at how a dedicated geospatial analysis service compares to a plain WMS layer for the task at hand. Reviewing real-world industry use cases or checking current pricing plans can help clarify whether a standards-based map service or a purpose-built AI analysis platform is the better fit for a given project.
Preguntas frecuentes
Version 1.3.0 is the current OGC standard and changed how certain coordinate reference systems handle axis order, along with some parameter naming. Many legacy servers and clients still default to 1.1.1 for compatibility, so it’s worth checking which version a target client expects before building against a new endpoint.
Just images. WMS renders a map on the server and sends back a picture (PNG, JPEG, etc.). For raw feature geometry, WFS is the relevant OGC standard instead.
It can serve rendered previews of such imagery, but it isn’t built for pixel-level analysis. Workflows that need to detect objects or measure features within the imagery typically require dedicated analysis tools rather than a rendered WMS tile.
Yes, particularly for dynamic, on-demand map views where pre-caching every possible tile isn’t practical. WMTS has largely taken over for high-traffic, cache-friendly base maps, but WMS still fits use cases needing flexible styling or custom extents per request.
GeoServer and MapServer are the two most widely deployed open-source options, alongside commercial platforms like ArcGIS Server. The choice usually depends on existing infrastructure and licensing preferences rather than any hard technical requirement.
Start by requesting GetCapabilities in a browser to confirm layers and CRS entries appear as expected, then manually build a GetMap URL with a known bounding box to check the rendered output. Most GIS desktop clients also have a built-in WMS connection wizard that surfaces errors quickly.
The WMS specification doesn’t define authentication itself, so it has to be added separately—typically through a reverse proxy, API gateway, or server-level access rules restricting which layers a given user can request.