
Kurzzusammenfassung: Aqueduct ist eine umfassende Plattform zur Kartierung von Wasserrisiken, entwickelt vom World Resources Institute. Sie unterstützt Organisationen bei der Bewertung aktueller und zukünftiger Wasserknappheit, Hochwasserrisiken und Dürreperioden in globalen Wassereinzugsgebieten. Das Tool kombiniert hydrologische Modelle mit Klimaprognosen und liefert so praxisrelevante Erkenntnisse für Unternehmen, Regierungen und Forscher, die wasserbezogene Risiken managen. Dank aktueller Updates, darunter Version 4.0 und spezialisierter Module wie dem Floods Cost-Benefit Analyzer, hat sich Aqueduct zum Branchenstandard für die Bewertung von Herausforderungen der Wassersicherheit entlang von Betriebsabläufen und Lieferketten entwickelt.
Wasserknappheit ist keine ferne Bedrohung mehr. Unternehmen, Regierungen und Gemeinden stehen unter zunehmendem Druck, die verborgenen Wasserrisiken in ihren Betriebsabläufen und Lieferketten zu identifizieren.
Hier kommt das Aqueduct-Tool ins Spiel. Diese vom World Resources Institute entwickelte Plattform hat sich zu einem der weltweit am häufigsten verwendeten Instrumente zur Bewertung von Wasserrisiken entwickelt. Aber hält sie, was sie verspricht?
Dieser Testbericht erläutert die Funktionsweise von Aqueduct, die Genauigkeit der Daten und ob es für Ihre Anforderungen im Bereich Wasserrisikomanagement geeignet ist.
Was ist das Aquädukt-Werkzeug?
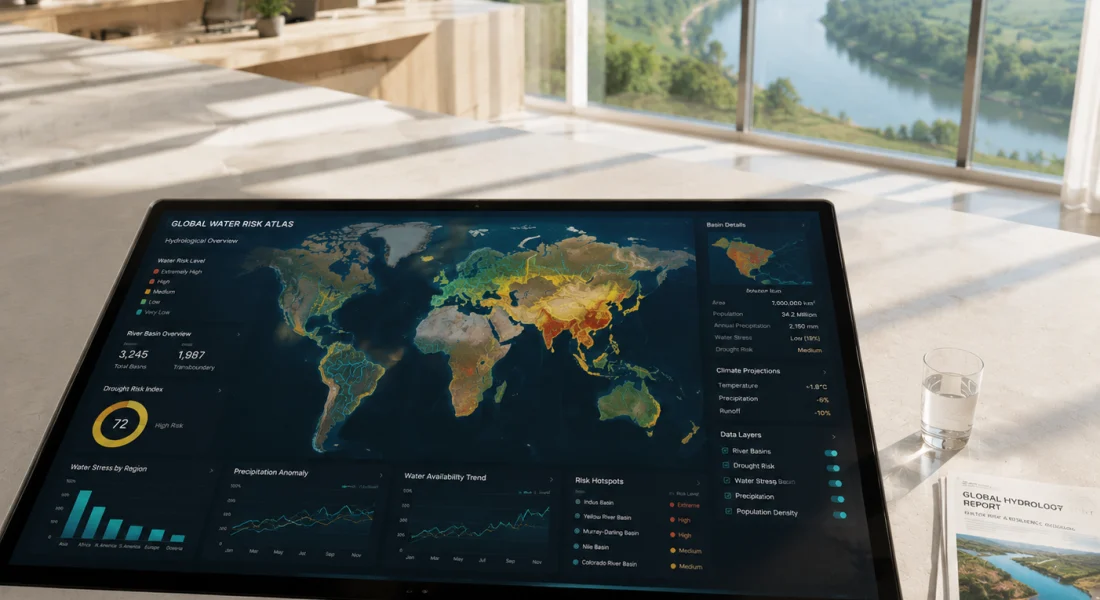
Aqueduct ist eine frei zugängliche Plattform zur Kartierung von Wasserrisiken, die Daten auf Einzugsgebietsebene zu Wasserstress, Dürrerisiko, Hochwasserrisiko und saisonalen Schwankungen bereitstellt. Das World Resources Institute hat sie entwickelt, um Organisationen bei der Identifizierung und Priorisierung wasserbezogener Risiken in verschiedenen Regionen zu unterstützen.
Das Tool verknüpft hydrologische Daten, Klimamodelle und sozioökonomische Indikatoren zu 13 verschiedenen Wasserrisikoindikatoren. Nutzer können die aktuelle Situation und Zukunftsprognosen bis 2050 unter verschiedenen Klimaszenarien untersuchen.
Im Gegensatz zu einfachen Wasserstressrechnern liefert Aqueduct detaillierte Daten auf Einzugsgebietsebene und nicht nur Landes- oder Regionaldurchschnittswerte. Dies ist besonders wichtig, wenn Ihre Betriebsstätten mehrere Standorte mit sehr unterschiedlichen Wasserbedingungen umfassen.
Kernkomponenten
Die Plattform umfasst mehrere integrierte Module:
- WasserrisikoatlasInteraktive Karten, die 13 Indikatoren für Wasserrisiken in globalen Wassereinzugsgebieten darstellen
- Kosten-Nutzen-Analyse für ÜberschwemmungenSpezialisiertes Instrument zur Bewertung von Investitionen in Hochwasserschutzinfrastruktur
- ZukunftsprognosenKlimaangepasste Szenarien bis 2050 basierend auf verschiedenen Emissionspfaden
- Länder-RankingVergleichende Analyse der Wasserknappheit in verschiedenen Ländern
Die Daten fließen in die Nachhaltigkeitsberichterstattung von Unternehmen, in Risikobewertungen der Lieferkette und in die strategische Planung ein. Große Konzerne wie PepsiCo und Unilever nutzen die Daten von Aqueduct in ihren Strategien zum verantwortungsvollen Umgang mit Wasser.
Wie Aquädukte das Wasserrisiko messen
Aqueduct misst das Wasserrisiko nicht mit einer einzigen Kennzahl. Stattdessen unterteilt es das Risiko anhand von 13 verschiedenen Indikatoren in physische, regulatorische und reputationsbezogene Kategorien.
Zu den Risiken physikalischer Größen zählen die Grundwasserbelastung (das Verhältnis von Wasserentnahmen zu verfügbaren erneuerbaren Ressourcen), die jährliche und saisonale Variabilität, die Grundwasserbelastung sowie das Dürrerisiko. Diese Indikatoren zeigen, wo und wann die Wasserversorgung möglicherweise nicht ausreicht.
Das Risiko der physikalischen Wasserqualität umfasst unbehandeltes, angeschlossenes Abwasser und das Potenzial der Küsteneutrophierung – Faktoren, die Einfluss darauf haben, ob das verfügbare Wasser tatsächlich nutzbar ist.
Zu den regulatorischen und Reputationsrisiken zählen der unzureichende Zugang zu Trinkwasser, der unzureichende Zugang zu sanitären Einrichtungen sowie die höchsten RepRisk-Länderrisikobewertungen in den Bereichen Umwelt, Soziales und Regierungsführung.
Datenquellen und Methodik
Aqueduct greift auf mehrere maßgebliche Datenquellen zurück. Hydrologische Daten stammen aus globalen Modellen wie PCR-GLOBWB, das Wasserverfügbarkeit und -bedarf mit hoher räumlicher Auflösung simuliert. Klimaprojektionen integrieren mehrere allgemeine Zirkulationsmodelle unter verschiedenen repräsentativen Konzentrationspfaden.
Die Berechnung des Wasserstressniveaus erfolgt durch Division der jährlichen Wasserentnahmen durch die verfügbaren erneuerbaren Oberflächen- und Grundwasserressourcen. Werte über 401 TP3T deuten auf eine hohe Belastung hin, Werte über 801 TP3T auf eine extrem hohe Belastung, bei der die Nachfrage das Angebot übersteigt.
Die jüngsten Aktualisierungen von Aqueduct 4.0 verbesserten die räumliche Auflösung und integrierten aktualisierte Klimamodelle. Das Tool liefert nun Daten auf Einzugsgebietsebene für über 100.000 Teileinzugsgebiete weltweit.
Land und Infrastruktur mit FlyPix AI überwachen
Organisationen benötigen häufig eine zuverlässige Methode zur Überwachung großer Gebiete, ohne stundenlang Bildmaterial manuell auswerten zu müssen. FlyPix AI bietet KI-gestützte Tools zur Analyse von Geodatenbildern und zur Erkennung von Veränderungen an Standorten, Anlagen und in Landschaften.
Benötigen Sie eine bessere Übersicht über große Gebiete?
FlyPix AI kann helfen bei:
- Analyse von Luft- und Satellitenbildern
- Infrastrukturüberwachung
- Grundstücks- und Anlagenverfolgung
- automatisierte Bildklassifizierung
👉 Probieren Sie FlyPix AI aus. um Lösungen für die raumbezogene Überwachung zu erforschen.
Der Kosten-Nutzen-Analysator für Überschwemmungen
Ein herausragendes Merkmal ist das spezielle Modul zur Kosten-Nutzen-Analyse von Überschwemmungen. Dieses Tool unterstützt Entscheidungsträger bei der Beurteilung, ob Investitionen in Hochwasserschutzinfrastruktur für bestimmte Standorte wirtschaftlich sinnvoll sind.
Das Analysetool berechnet sowohl die Bau- als auch die Instandhaltungskosten im Verhältnis zu den potenziell vermiedenen Hochwasserschäden. Die Baukosten werden anhand länderspezifischer Faktoren ermittelt, die die Kosten pro Infrastruktureinheit widerspiegeln.
Beispielsweise werden die Baukosten für Deich- und Uferbefestigungssysteme in den Vereinigten Staaten auf 1,4 Billionen US-Dollar pro Meter Tiefe und Kilometer Länge geschätzt. Diese Faktoren variieren je nach Land erheblich, abhängig von Lohnkosten, Materialkosten und der Komplexität des Bauvorhabens.
Die Nutzenseite schätzt den potenziell vermiedenen Schaden durch den Vergleich von Überschwemmungsszenarien mit und ohne Schutzinfrastruktur. Dies umfasst direkte Schäden an Gebäuden und Infrastruktur sowie wirtschaftliche Beeinträchtigungen.
Das Tool gibt ein Nutzen-Kosten-Verhältnis aus. Werte über 1,0 deuten darauf hin, dass der Nutzen die Kosten übersteigt, was die Investition wirtschaftlich rechtfertigen könnte. Werte unter 1,0 bedeuten, dass die Kosten in den modellierten Szenarien den Nutzen überwiegen.
Praktische Anwendungen
Städte nutzen das Analysetool, um Investitionen in den Hochwasserschutz in gefährdeten Stadtvierteln zu priorisieren. Entwicklungsbanken ziehen diese Berechnungen bei der Bewertung von Infrastrukturkreditanträgen heran.
Das Gesetz zur Finanzierung und Innovation der Wasserinfrastruktur (WIFIA) hat 153 Darlehen abgeschlossen und 23 Milliarden Pfund Sterling an Finanzmitteln bereitgestellt. Zudem werden 51 Milliarden Pfund Sterling für Wasserinfrastrukturprojekte unterstützt. Instrumente wie Aqueduct helfen dabei, Bereiche mit dem größten Nutzen solcher Investitionen zu identifizieren.
Globale Daten im lokalen Kontext verankern
Das Problem ist jedoch, dass globale Modelle ihre Grenzen haben. Daten auf Einzugsgebietsebene bieten zwar eine höhere Detailgenauigkeit als Länderdurchschnitte, erfassen aber möglicherweise dennoch nicht die hyperlokalen Gegebenheiten.
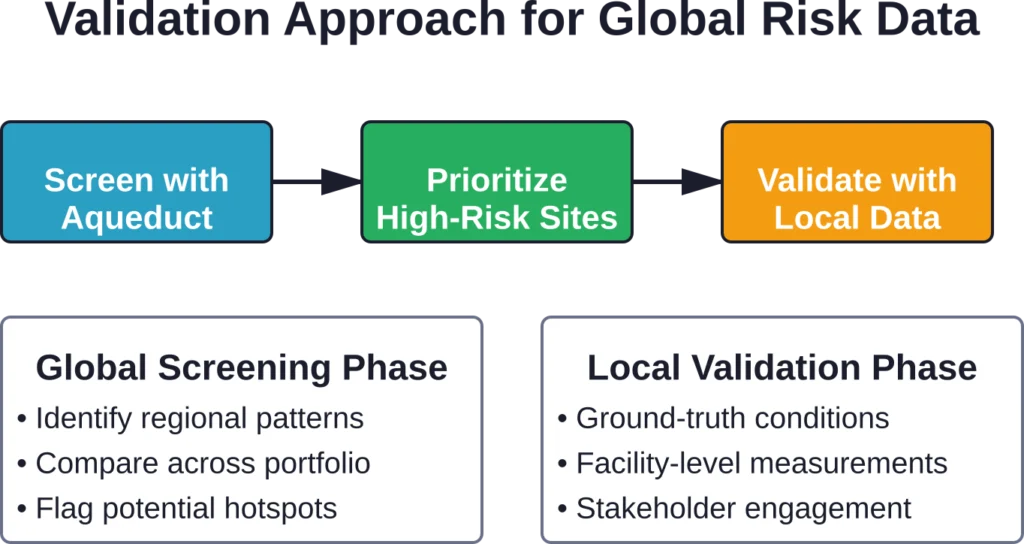
Eine Studie, die die globalen Bewertungen von Aqueduct mit lokalen Standortdaten vergleicht, zeigt sowohl Stärken als auch Schwächen auf. Das Tool eignet sich hervorragend zur Identifizierung regionaler Muster und zur vergleichenden Risikobewertung in verschiedenen Regionen. Für standortspezifische operative Entscheidungen ist es weniger präzise.
Unternehmen wie Unilever validieren die Daten von Aqueduct anhand lokaler Messungen an den jeweiligen Standorten. Sie haben festgestellt, dass Standorte, die den extremsten Wasserstressklassifizierungen von Aqueduct ausgesetzt sind, im Allgemeinen mit den tatsächlichen Bedingungen vor Ort übereinstimmen, obwohl die spezifischen Stressniveaus variieren können.
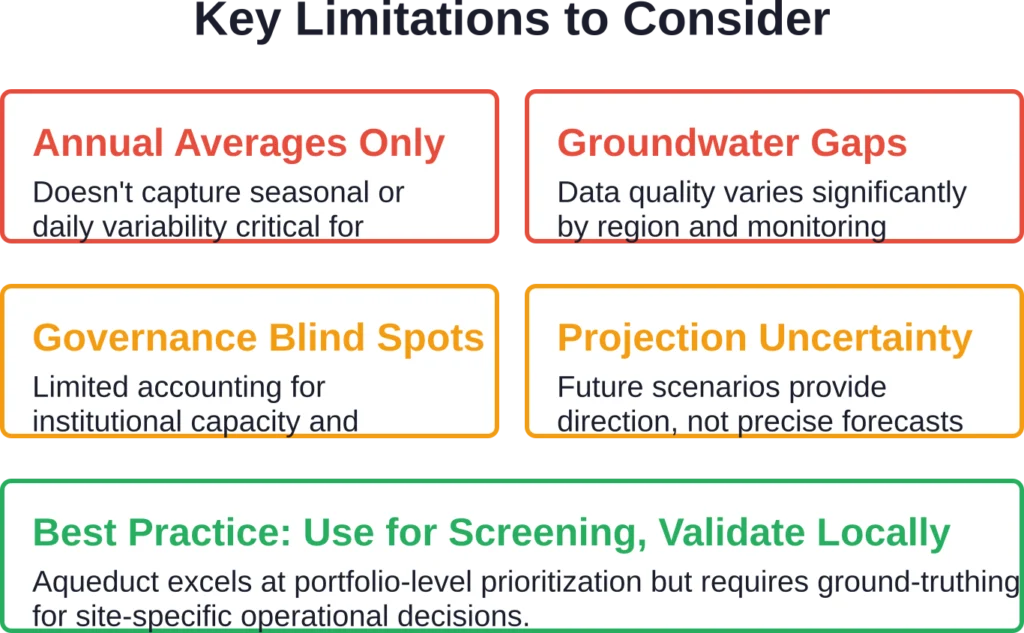
Das bedeutet, dass Aqueduct am besten als Screening- und Priorisierungsinstrument geeignet ist und nicht als Ersatz für lokale Wasserressourcenbewertungen. Nutzen Sie es, um Brennpunkte zu identifizieren, die einer eingehenderen Untersuchung bedürfen, nicht als endgültige Bewertung des standortspezifischen Risikos.
Validierung über verschiedene Regionen hinweg
Der Zusammenhang zwischen den Aquädukt-Scores und den lokalen Gegebenheiten variiert je nach Region und Risikotyp. Indikatoren für Wasserstress sind tendenziell zuverlässiger als Kennzahlen zur Wasserqualität, die stark von der lokalen Infrastruktur und den Bewirtschaftungspraktiken abhängen.
Hochwasserrisikobewertungen funktionieren gut für große Flusssysteme mit guten historischen Daten, unterschätzen aber möglicherweise das Risiko in Gebieten mit rascher Urbanisierung oder unzureichender Entwässerungsinfrastruktur, die in den zugrunde liegenden Modellen nicht erfasst wird.
Anwendungen in der Praxis
Nachhaltigkeitsteams in Unternehmen nutzen Aqueduct umfassend für Offenlegungspflichten und strategische Planung. Der CDP-Fragebogen zur Wassersicherheit, der jährlich von Tausenden von Unternehmen ausgefüllt wird, verweist ausdrücklich auf Aqueduct als empfohlene Risikobewertungsmethode.
PepsiCo integriert Daten des Aqueduct-Projekts in sein Wassermanagementkonzept. Das Unternehmen identifiziert Standorte in Gebieten mit hohem Wasserrisiko und priorisiert Sanierungsprojekte in diesen Einzugsgebieten. Ziel ist es, 1001 TP3T Wasser an firmeneigenen Standorten in Gebieten mit hohem Wasserrisiko wieder aufzufüllen.
Finanzinstitute integrieren Aqueduct in ihre Klimarisiko-Stresstests. Banken, die Agrarkreditportfolios bewerten, nutzen das Tool, um zu ermitteln, welche Regionen zunehmend mit Wasserknappheit konfrontiert sind, die die Rückzahlungsfähigkeit der Kreditnehmer beeinträchtigen könnte.
Die US-Umweltschutzbehörde (EPA) hat ergänzende Datensätze entwickelt, darunter auch die Grenzen der Versorgungsgebiete öffentlicher Wasserversorgungssysteme. Diese von der EPA regulierten Systeme versorgen rund 851.030 Amerikaner mit Trinkwasser. In Kombination mit den Risikoindikatoren von Aqueduct können Organisationen die Belastung bis auf die einzelnen Versorgungsgebiete genau kartieren.
Risikobewertung der Lieferkette
Multinationale Unternehmen gleichen die Standorte ihrer Lieferanten mit Daten von Aqueduct ab, um Schwachstellen in ihren Lieferketten zu identifizieren. Ein Lebensmittelhersteller könnte beispielsweise feststellen, dass 301 seiner landwirtschaftlichen Zulieferer in Wassereinzugsgebieten tätig sind, die bis 2040 voraussichtlich extremer Wasserknappheit ausgesetzt sein werden.
Dies beeinflusst strategische Entscheidungen hinsichtlich Lieferantendiversifizierung, Investitionen in wassersparende Bewässerungstechnologien oder alternativer Beschaffungsstrategien. Transparenz ist entscheidend – das Wasserrisiko in der Lieferkette übersteigt in vielen Branchen oft das direkte operative Risiko.
Vergleich von Aquädukten mit anderen Instrumenten zur Risikobewertung im Wassersektor
Aqueduct ist nicht das einzige verfügbare Instrument zur Bewertung von Wasserrisiken. Wie schneidet es im Vergleich zu Alternativen ab?
Der WWF-Wasserrisikofilter bietet ähnliche Funktionen mit leicht abweichenden Indikatorensätzen und legt einen stärkeren Fokus auf die Bewirtschaftung von Einzugsgebieten und die Einbindung von Interessengruppen. Der Standard der Alliance for Water Stewardship bietet einen Zertifizierungsrahmen anstelle einer reinen Risikokartierung.
| Werkzeug | Hauptfokus | Räumliche Auflösung | Kosten | Am besten geeignet für |
|---|---|---|---|---|
| WRI-Aquädukt | Physikalisches Wasserrisiko | Wasserscheide | Frei | Globales Portfolio-Screening |
| WWF Wasserrisikofilter | Risiko + Kontext | Becken | Frei | Kontextuelle Beurteilung |
| Ecolab Water Risk Monetizer | Finanzielle Auswirkungen | Einrichtung | Bezahlt | Entwicklung eines Business Case |
| EPANET | Verteilungssysteme | Rohrnetz | Frei | Infrastrukturmodellierung |
EPANET stellt eine völlig andere Kategorie dar – es handelt sich um ein Werkzeug zur hydraulischen Modellierung von Wasserverteilungssystemen und nicht um eine Plattform zur Risikobewertung. Die von der EPA veröffentlichte Version EPANET 2.2 (Veröffentlichung: 23. Juli 2020) unterstützt Ingenieure bei der Planung und Optimierung der Trinkwasserinfrastruktur. Die Software hat eine Downloadgröße von 3,5 MB.
Für Organisationen, die die finanziellen Auswirkungen quantifizieren müssen, gibt es spezialisierte Tools wie den Water Risk Monetizer von Ecolab, der physische Risiken in monetäre Werte umrechnet. Diese kostenpflichtigen Plattformen bieten in der Regel detailliertere Analysen auf Anlagenebene, erfordern jedoch einen erheblichen Datenaufwand.
Integrationsmöglichkeiten
Viele Organisationen nutzen Aqueduct in Kombination mit anderen Tools, anstatt sich ausschließlich dafür zu entscheiden. Beginnen Sie mit dem kostenlosen globalen Screening von Aqueduct und setzen Sie anschließend kostenpflichtige Tools oder lokale Analysen für Standorte mit hoher Priorität ein.
Die offene Zugänglichkeit der Aqueduct-Daten macht sie besonders wertvoll für die akademische Forschung, die Politikanalyse und die Arbeit von gemeinnützigen Organisationen, wo Budgetbeschränkungen den Zugang zu kommerziellen Plattformen einschränken.
Einschränkungen und Überlegungen
Kein Instrument zur Bewertung von Wasserrisiken ist perfekt. Das Verständnis der Grenzen von Aquädukten beugt Missbrauch und unrealistischen Erwartungen vor.
Die zeitliche Auflösung ist begrenzt. Das Tool liefert Jahresmittelwerte und erfasst keine täglichen oder wöchentlichen Schwankungen, die für operative Entscheidungen relevant sein könnten. Ein Einzugsgebiet kann zwar einen mäßigen jährlichen Wasserstress aufweisen, aber während kritischer Vegetationsperioden unter starkem Wassermangel leiden.
Die Qualität der Grundwasserdaten variiert stark je nach Region. Länder mit gut ausgebauten Messnetzen liefern bessere Daten für die zugrunde liegenden Modelle als Regionen mit einer lückenhaften Messinfrastruktur.
Das Instrument berücksichtigt über grundlegende Indikatoren hinaus weder institutionelle Kapazitäten noch die Qualität der Regierungsführung. Zwei Wassereinzugsgebiete mit identischer physikalischer Wasserbelastung können je nach Managementeffektivität, Infrastrukturqualität und Durchsetzung von Vorschriften sehr unterschiedliche tatsächliche Risiken bergen.
Jüngste Forschungsergebnisse der UC Santa Barbara, die 67 Fälle erfolgreicher Grundwassergewinnung analysierten, zeigten, dass 81% alternative Wasserquellen zur Deckung des Bedarfs nutzte. Darüber hinaus umfasste 52% politische und marktwirtschaftliche Interventionen, während 48% Strategien zur künstlichen Grundwasseranreicherung einbezog. Diese institutionellen Faktoren – entscheidend für das Verständnis des tatsächlichen Risikos und des Gewinnungspotenzials – werden in den quantitativen Indikatoren von Aqueduct nicht vollständig erfasst.
Unsicherheit bei Zukunftsprognosen
Klimaprognosen bis 2050 sind naturgemäß mit Unsicherheiten behaftet. Aqueduct liefert Szenarien unter verschiedenen Emissionspfaden, doch die tatsächlichen Bedingungen hängen von politischen Entscheidungen, technologischem Wandel und natürlichen Schwankungen ab, die kein Modell perfekt vorhersagen kann.
Betrachten Sie Zukunftsprognosen als plausible Szenarien für Stresstests und nicht als definitive Vorhersagen. Die Richtung der Veränderung ist wichtiger als präzise Werte – wenn mehrere Szenarien eine zunehmende Belastung zeigen, ist das ein aussagekräftiges Signal, unabhängig vom genauen Ausmaß.
Erste Schritte mit Aquädukt
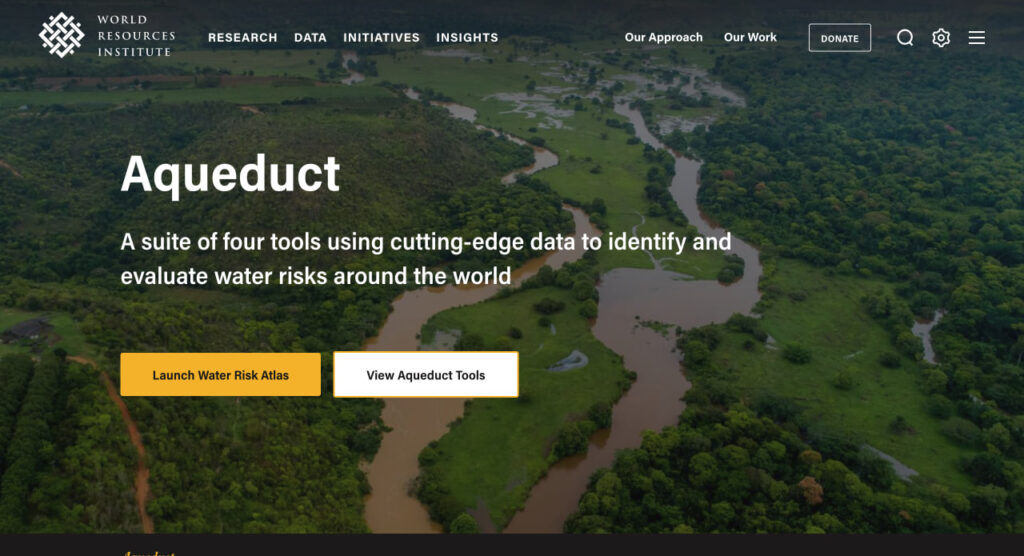
Für den Zugriff auf Aqueduct benötigen Sie lediglich einen Webbrowser. Rufen Sie die WRI-Website auf und starten Sie den Water Risk Atlas direkt.
Die Benutzeroberfläche ermöglicht die Suche nach Standorten, das Hochladen von Koordinaten von Einrichtungen per Tabellenkalkulation oder die interaktive Erkundung durch Hineinzoomen in interessante Bereiche. Jeder Indikator enthält eine Dokumentation, die die Methodik und die Datenquellen erläutert.
Für eine erste Einschätzung sollten Sie zunächst alle Ihre Betriebsstandorte kartieren und nach Standorten mit hohem oder extrem hohem Wasserstress filtern. Dadurch wird sofort deutlich, wo detaillierte Bewertungsmaßnahmen erforderlich sind.
Das Tool exportiert Daten in verschiedenen Formaten, darunter CSV, zur Integration in GIS-Plattformen oder Business-Intelligence-Dashboards. Organisationen mit Hunderten oder Tausenden von Standorten automatisieren häufig regelmäßige Datenabfragen von Aquäduktdaten, um veränderliche Bedingungen zu überwachen.
Erweiterte Funktionen
Fortgeschrittene Nutzer können über APIs auf die zugrundeliegenden Daten für individuelle Analysen zugreifen. Der Datensatz „Aqueduct 4.0“ ist über Plattformen wie das Colorado Geospatial Portal verfügbar und ermöglicht so die Integration in staatliche und regionale Planungsprozesse.
Die Kombination von Aquäduktdaten mit internen Betriebskennzahlen ermöglicht die Erstellung differenzierterer Risikoprofile. Durch den Abgleich von Wasserstresswerten mit Produktionsmengen, Umsatzkonzentration oder Abhängigkeiten in der Lieferkette lässt sich das risikogewichtete Expositionsrisiko berechnen.
Aktuelle Entwicklungen und zukünftige Ausrichtung
Das World Resources Institute entwickelt die Plattform weiterhin aktiv. Aqueduct 4.0 stellte ein bedeutendes Update mit verbesserten hydrologischen Modellen und erweiterten Klimaszenarien dar.
Zu den laufenden Arbeiten gehören die Integration hochauflösender Datenquellen, die Erweiterung der Indikatoren für die Wasserqualität und die Verbesserung der Erfassung der Grundwassererschöpfung. Die EPA veröffentlichte im März 2026 die Version 3 ihres Datensatzes zu den Versorgungsgebieten öffentlicher Wasserversorgungssysteme, der temporäre und permanente Versorgungsgebiete außerhalb von Kommunen darstellt.
Diese sich ergänzenden Bemühungen von Regierungsbehörden und Forschungsorganisationen stärken das gesamte Ökosystem der Wasserdaten, auf das Tools wie Aqueduct zurückgreifen.
Zukünftige Entwicklungen könnten verstärkt Echtzeitdatenquellen, satellitengestützte Messungen und maschinelle Lernverfahren einbeziehen, um die Vorhersagegenauigkeit zu verbessern. Der grundlegende Nutzen – die Demokratisierung des Zugangs zu Informationen über Wasserrisiken – bleibt jedoch unverändert.
Wer sollte ein Aquädukt nutzen?
Aquädukt eignet sich besonders gut für mehrere unterschiedliche Anwendungsfälle:
- Multinationale Konzerne Notwendigkeit, Wasserrisiken in diversen globalen Portfolios zu analysieren.
- Investoren Durchführung von Due-Diligence-Prüfungen zum Klimarisiko bei Portfoliounternehmen oder potenziellen Akquisitionen
- Regierungen und Entwicklungsorganisationen Planung von Infrastrukturinvestitionen oder wasserpolitischen Maßnahmen
- Forscher Studium der Wassersicherheit, der Klimaanpassung oder des Ressourcenmanagements
- Supply-Chain-Manager Identifizierung von Schwachstellen in landwirtschaftlichen oder industriellen Liefernetzwerken
Kleine und mittlere Unternehmen mit konzentrierten Geschäftstätigkeiten finden lokale Wassereinzugsgebietsanalysen möglicherweise unmittelbarer umsetzbar als globale Instrumente. Aber auch kleinere Organisationen profitieren vom Verständnis des relativen Risikos – befindet sich unser einziger Standort in einer wasserarmen Region im Vergleich zu Alternativen?
Akademische Einrichtungen nutzen die Daten von Aqueduct umfassend für Forschungsarbeiten zu den Zusammenhängen zwischen Wasser, Energie und Ernährung, zur Klimaanpassungsplanung und zur nachhaltigen Entwicklung. Das Open-Access-Modell beseitigt die Hürden, die proprietäre Daten für Forschung und Lehre darstellen.
Häufig gestellte Fragen
Ja, Aqueduct ist komplett kostenlos und frei zugänglich. Das World Resources Institute stellt das Tool und die zugrundeliegenden Daten kostenlos zur Verfügung, um das Bewusstsein für Wasserrisiken zu fördern. Für den Zugriff auf die Kernfunktionen des Wasserrisikoatlas und des Kosten-Nutzen-Analysators für Überschwemmungen ist keine Registrierung oder ein Abonnement erforderlich.
Größere Plattformaktualisierungen erfolgen alle paar Jahre, wobei Aqueduct 4.0 die aktuellste umfassende Version darstellt. Die zugrunde liegenden Datenquellen werden in unterschiedlichen Abständen aktualisiert – hydrologische Modelle in der Regel jährlich, während Klimaprojektionen aktualisiert werden, sobald neue Ergebnisse des Allgemeinen Zirkulationsmodells (GCM) verfügbar sind. Die Plattformdokumentation gibt das jeweilige Aktualitätsdatum der einzelnen Datensätze an.
Aqueduct liefert Daten auf Einzugsgebietsebene anstelle von standortspezifischen Bewertungen. Nutzer können bestimmte Koordinaten oder Adressen eingeben, und das Tool liefert Risikoindikatoren für das Einzugsgebiet, in dem sich dieser Standort befindet. Mehrere Anlagen im selben Einzugsgebiet erhalten identische Bewertungen, obwohl die tatsächlichen Gegebenheiten im kleineren Maßstab variieren können.
Zukunftsprognosen stellen plausible Szenarien dar, die auf Klimamodellen und sozioökonomischen Annahmen basieren, nicht aber präzise Vorhersagen. Ihre Genauigkeit hängt von der tatsächlichen Entwicklung der Emissionen, politischen Maßnahmen und dem technologischen Wandel ab. Die Prognosen eignen sich am besten zur Identifizierung von Trends und zum Vergleich des relativen Risikos an verschiedenen Standorten, weniger jedoch zur exakten Vorhersage zukünftiger Bedingungen.
Ja, Aqueduct berücksichtigt die Grundwasserbelastung als spezifischen Indikator und misst das Verhältnis von Grundwasserentnahme zu Neubildung. Die Qualität der Grundwasserdaten variiert jedoch je nach Region und Überwachungsinfrastruktur erheblich. Gebiete mit begrenzten Grundwassermessnetzen liefern möglicherweise weniger zuverlässige Schätzungen als Regionen mit umfassenden Überwachungssystemen.
Absolut. Aqueduct genießt in der Nachhaltigkeitsberichterstattung von Unternehmen hohes Ansehen und wird in Rahmenwerken wie CDP Water Security explizit erwähnt. Viele Fortune-500-Unternehmen zitieren Aqueduct-Daten in ihren jährlichen Nachhaltigkeitsberichten, Investorenmitteilungen und regulatorischen Meldungen zum Thema Klimarisiken.
Diese Tools dienen völlig unterschiedlichen Zwecken. Aqueduct bewertet das Wasserrisiko auf Einzugsgebietsebene für die strategische Planung und Risikobewertung. EPANET modelliert das hydraulische Verhalten in Wasserverteilungsnetzen für die Infrastrukturplanung und -optimierung. Aqueduct beantwortet die Frage “Wo ist das Wasserrisiko am höchsten?”, während EPANET die Frage beantwortet “Wie fließt das Wasser durch dieses spezifische Rohrleitungssystem?”.”
Das Urteil
Aqueduct erfüllt sein Kernversprechen: zugängliche und umfassende Daten zum Wasserrisiko auf globaler Ebene. Das Tool demokratisiert anspruchsvolle Analysen, für die zuvor teure Berater oder proprietäre Plattformen erforderlich waren.
Die größten Stärken sind die umfassende Abdeckung, die regelmäßigen Aktualisierungen und die kostenlose Nutzung. Organisationen können Tausende von Standorten innerhalb von Minuten überprüfen und Prioritätsbereiche für weitere Untersuchungen identifizieren.
Aufgrund von Einschränkungen hinsichtlich der zeitlichen Auflösung, der lokalen Genauigkeit und institutioneller Faktoren stellt dies keine vollständige Lösung für Wasserrisiken dar. Betrachten Sie es als ersten Schritt in einem Prozess, nicht als endgültige Antwort.
Für Portfolio-Screening, strategische Planung und Nachhaltigkeitsberichterstattung ist Aqueduct kaum zu übertreffen. Es hat sich zum De-facto-Standard für die Offenlegung von Wasserrisiken in Unternehmen entwickelt, gerade weil es konsistente und nachvollziehbare Daten in großem Umfang liefert.
Organisationen, denen verantwortungsvoller Umgang mit Wasser am Herzen liegt, sollten Aqueduct unbedingt in ihre Risikobewertungsinstrumente einbeziehen. Doch damit nicht genug: Die Ergebnisse müssen lokal validiert, Interessengruppen einbezogen und kontextspezifische Managementmaßnahmen entwickelt werden.
Wasserrisiken sind naturgemäß lokal begrenzt, doch das Verständnis globaler Muster hilft dabei, Prioritäten dort zu setzen, wo lokale Maßnahmen am wichtigsten sind. Genau das ermöglicht Aqueduct.